

EV charging adapter market size to grow by USD 6,318.88 million from 2022 to 2027: Highlights on COVID-19 analysis, recovery, and latest trends - Technavio
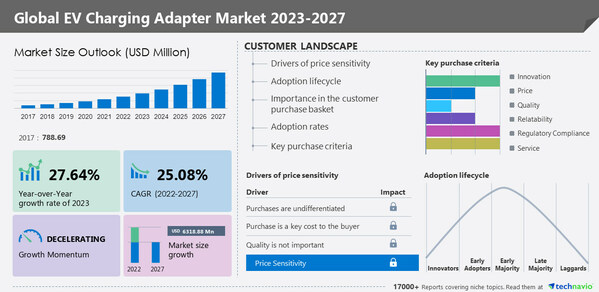 |
NEW YORK, Feb. 3, 2023 -- The global EV charging adapter market size is estimated to increase by USD 6,318.88 million between 2022 and 2027. However, the market's growth momentum will decelerate at a CAGR of 25.08% during the forecast period. The report includes historic market data from 2017 to 2021. In 2017, the market was valued at USD 788.69 million. COVID-19 had the most negative impact on the global automotive industry in recent years, which resulted in a steep fall in demand and large-scale disruption of the supply chain. It exerted intense pressure on an already-stressed global automotive market. However, there are predictions that a few countries are bringing manufacturing facilities and production back on track, indicating that the supply side is on a restoration line. For more insights on the EV charging adapter market - Request a sample report
Key trends – The use of ultracapacitors in EV energy storage systems is a key trend in the market. An ultracapacitor is an energy storage device that stores energy through chemical processes. An ultracapacitor conducts electricity through an electric field and can store higher charge quantities when compared to a battery. Therefore, it has a higher energy density. EVs can draw power from ultracapacitors during peak power load conditions. This helps reduce the load on the primary energy source, such as a Li-ion battery or an ultracapacitor module. Therefore, the use of ultracapacitors in EVs is expected to have a positive impact on the market during the forecast period. To know more - Buy the report!
Global EV charging adapter market - Customer Landscape
To help companies evaluate and develop growth strategies, the report outlines –
- Key purchase criteria
- Adoption rates
- Adoption lifecycle
- Drivers of price sensitivity
Global EV charging adapter market – Vendor analysis
Vendor landscape –
The global EV charging adapter market is fragmented, with the presence of a few international and several regional players. A few prominent vendors that offer EV charging adapters in the market are ABB Ltd., Aptiv PLC, ChargePoint Inc., CHONGQING SENKU MACHINERY IMP AND EXP Co. Ltd., Delta Electronics Inc., Eaton Corp. Plc, EDF Energy Holdings Ltd, Enel Spa, EV Safe Charge Inc, FLO Services USA Inc., Kempower Oy, Lectron EV, Leviton Manufacturing Co. Inc., Phihong USA Corp., Robert Bosch GmbH, Schneider Electric SE, Shanghai Mida EV Power Co. Ltd., Shanghai Zencar Industry Co Ltd, Siemens AG, and Webasto SE and others.
As the market is capital intensive, small players find it difficult to compete with large international players in terms of quality, features, and services. The competition in the market is expected to intensify due to the potential increase in the demand for EVs. Technology will play a key role in increasing the competition between vendors during the forecast period. Partnerships among companies will lead to the development of commercially viable EV charging adapter systems.
Vendor offerings -
- ABB Ltd. - The company offers EV charging adapters, which are modular 175-350 kW high-power chargers ideally suited for highway corridor and EV fleet operations.
- Aptiv PLC - The company offers EV charging adapters with charging infrastructure for e-mobility.
- ChargePoint Inc. - The company offers EV charging adapters, which provide comprehensive charging for any fleet.
- Delta Electronics Inc. - The company offers EV charging adapters, which can be applied in a wide range of residential, commercial, workplace, public, and fleet charging sites.
Global EV charging adapter market - Segmentation assessment
Segment overview
Technavio has segmented the market based on type (AC and DC) and application (public and private).
- The AC segment will account for a significant share of the market's growth during the forecast period. In AC EV charging adapters, the convertor is kept inside the car and converts AC into DC. The adoption of these charging adapters is higher than DC EV charging adapters owing to their low cost of maintenance and installation. In addition, the tariffs to charge from AC EV charging adapters are also lower. These benefits will drive the growth of this segment growth during the forecast period
Geography overview
Based on geography, the global EV charging adapter market is segmented into APAC, Europe, North America, South America, and Middle East and Africa. The report provides actionable insights and estimates the contribution of all regions to the growth of the global EV charging adapter market.
- APAC is estimated to account for 48% of the growth of the global market during the forecast period. The rapid growth of the regional market is attributed to factors such as the increase in demand for EVs from countries such as China, Japan, Singapore, India, Thailand, and South Korea. The governments of many countries are taking initiatives to reduce greenhouse gas emissions by encouraging the use of EVs and offering subsidies and incentives, which is expected to further increase the demand for EVs. These factors will drive the growth of the market in the region during the forecast period.
Download a sample report
Global EV charging adapter market – Market dynamics
Leading drivers - Increasing EV sales through tax incentives is driving the growth of the market. The rise in EV sales is fueling the demand for well-built EV charger infrastructure. Governments and regulatory bodies are providing incentives and subsidies to EV buyers. For instance, in Ireland, the Sustainable Energy Authority provides grants of up to USD 5,500 to USD 6,000 and an exemption from vehicle registration tax to EV buyers. In Italy, buyers of full-electric or hybrid vehicles can get an exemption from the annual registration tax for five years after purchase. Such incentives are increasing the demand for electric vehicles, which will drive the growth of the market during the forecast period.
Major challenges – The increasing cost pressure is challenging the growth of the market. The cost pressure affects the sales of AC level 2 and DC fast chargers. The increasing number of PEVs equipped with AC Level 2 chargers and developments in charging infrastructure in public places will compel OEMs to invest more during the forecast period. However, manufacturers are unable to push the added cost to buyers due to price sensitivity. This may reduce the demand for EV charging adapters, which, in turn, will hinder the growth of the market during the forecast period.
Drivers and challenges have an impact on market dynamics, which can impact businesses. Find more insights in a sample report!
What are the key data covered in this EV charging adapter market report?
- CAGR of the market during the forecast period
- Detailed information on factors that will drive the growth of the EV charging adapter market between 2023 and 2027
- Precise estimation of the size of the EV charging adapter market and its contribution to the parent market
- Accurate predictions about upcoming trends and changes in consumer behavior
- Growth of the EV charging adapter market across APAC, Europe, North America, South America, and Middle East and Africa
- A thorough analysis of the market's competitive landscape and detailed information about vendors
- Comprehensive analysis of factors that will challenge the growth of EV charging adapter market vendors
Gain instant access to 17,000+ market research reports.
Technavio's SUBSCRIPTION platform
Related Reports:
The electric vehicle (EV) motor market is estimated to grow at a CAGR of 20.87% between 2022 and 2027. The size of the market is forecasted to increase by USD 14,492.96 million. This report extensively covers market segmentation by power rating (MPR, HPR, and IPR), type (AC motor and DC motor), and geography (APAC, Europe, North America, South America, and Middle East and Africa).
The electric vehicle (EV) charging station market size is expected to increase by USD 15.81 billion by 2026, and the market's growth momentum will accelerate at a CAGR of 20.65%. This report extensively covers the electric vehicle (EV) charging station market segmentation by type (AC and DC) and geography (APAC, Europe, North America, MEA, and South America).
|
EV Charging Adapter Market Scope |
|
|
Report Coverage |
Details |
|
Page number |
167 |
|
Base year |
2022 |
|
Historic period |
2017-2021 |
|
Forecast period |
2023-2027 |
|
Growth momentum & CAGR |
Decelerate at a CAGR of 25.08% |
|
Market growth 2023-2027 |
USD 6,318.88 million |
|
Market structure |
Fragmented |
|
YoY growth 2022-2023 (%) |
27.64 |
|
Regional analysis |
APAC, Europe, North America, South America, and Middle East and Africa |
|
Performing market contribution |
APAC at 48% |
|
Key countries |
US, China, Japan, Norway, and Germany |
|
Competitive landscape |
Leading vendors, market positioning of vendors, competitive strategies, and industry risks |
|
Key companies profiled |
ABB Ltd., Aptiv PLC, ChargePoint Inc., CHONGQING SENKU MACHINERY IMP AND EXP Co. Ltd., Delta Electronics Inc., Eaton Corp. Plc, EDF Energy Holdings Ltd, Enel Spa, EV Safe Charge Inc, FLO Services USA Inc., Kempower Oy, Lectron EV, Leviton Manufacturing Co. Inc., Phihong USA Corp., Robert Bosch GmbH, Schneider Electric SE, Shanghai Mida EV Power Co. Ltd., Shanghai Zencar Industry Co Ltd, Siemens AG, and Webasto SE |
|
Market dynamics |
Parent market analysis, market growth inducers and obstacles, fast-growing and slow-growing segment analysis, COVID-19 impact and recovery analysis and future consumer dynamics, and market condition analysis for the forecast period. |
|
Customization purview |
If our report has not included the data that you are looking for, you can reach out to our analysts and get segments customized. |
Browse for Technavio's consumer discretionary market reports
Table of contents
1 Executive Summary
- 1.1 Market overview
- Exhibit 01: Executive Summary – Chart on Market Overview
- Exhibit 02: Executive Summary – Data Table on Market Overview
- Exhibit 03: Executive Summary – Chart on Global Market Characteristics
- Exhibit 04: Executive Summary – Chart on Market by Geography
- Exhibit 05: Executive Summary – Chart on Market Segmentation by Type
- Exhibit 06: Executive Summary – Chart on Market Segmentation by Application
- Exhibit 07: Executive Summary – Chart on Incremental Growth
- Exhibit 08: Executive Summary – Data Table on Incremental Growth
- Exhibit 09: Executive Summary – Chart on Vendor Market Positioning
2 Market Landscape
- 2.1 Market ecosystem
- Exhibit 10: Parent market
- Exhibit 11: Market Characteristics
3 Market Sizing
- 3.1 Market definition
- Exhibit 12: Offerings of vendors included in the market definition
- 3.2 Market segment analysis
- Exhibit 13: Market segments
- 3.3 Market size 2022
- 3.4 Market outlook: Forecast for 2022-2027
- Exhibit 14: Chart on Global - Market size and forecast 2022-2027 ($ million)
- Exhibit 15: Data Table on Global - Market size and forecast 2022-2027 ($ million)
- Exhibit 16: Chart on Global Market: Year-over-year growth 2022-2027 (%)
- Exhibit 17: Data Table on Global Market: Year-over-year growth 2022-2027 (%)
4 Historic Market Size
- 4.1 Global EV charging adapter market 2017 - 2021
- Exhibit 18: Historic Market Size – Data Table on Global EV charging adapter market 2017 - 2021 ($ million)
- 4.2 Type Segment Analysis 2017 - 2021
- Exhibit 19: Historic Market Size – Type Segment 2017 - 2021 ($ million)
- 4.3 Application Segment Analysis 2017 - 2021
- Exhibit 20: Historic Market Size – Application Segment 2017 - 2021 ($ million)
- 4.4 Geography Segment Analysis 2017 - 2021
- Exhibit 21: Historic Market Size – Geography Segment 2017 - 2021 ($ million)
- 4.5 Country Segment Analysis 2017 - 2021
- Exhibit 22: Historic Market Size – Country Segment 2017 - 2021 ($ million)
5 Five Forces Analysis
- 5.1 Five forces summary
- Exhibit 23: Five forces analysis - Comparison between 2022 and 2027
- 5.2 Bargaining power of buyers
- Exhibit 24: Chart on Bargaining power of buyers – Impact of key factors 2022 and 2027
- 5.3 Bargaining power of suppliers
- Exhibit 25: Bargaining power of suppliers – Impact of key factors in 2022 and 2027
- 5.4 Threat of new entrants
- Exhibit 26: Threat of new entrants – Impact of key factors in 2022 and 2027
- 5.5 Threat of substitutes
- Exhibit 27: Threat of substitutes – Impact of key factors in 2022 and 2027
- 5.6 Threat of rivalry
- Exhibit 28: Threat of rivalry – Impact of key factors in 2022 and 2027
- 5.7 Market condition
- Exhibit 29: Chart on Market condition - Five forces 2022 and 2027
6 Market Segmentation by Type
- 6.1 Market segments
- Exhibit 30: Chart on Type - Market share 2022-2027 (%)
- Exhibit 31: Data Table on Type - Market share 2022-2027 (%)
- 6.2 Comparison by Type
- Exhibit 32: Chart on Comparison by Type
- Exhibit 33: Data Table on Comparison by Type
- 6.3 AC - Market size and forecast 2022-2027
- Exhibit 34: Chart on AC - Market size and forecast 2022-2027 ($ million)
- Exhibit 35: Data Table on AC - Market size and forecast 2022-2027 ($ million)
- Exhibit 36: Chart on AC - Year-over-year growth 2022-2027 (%)
- Exhibit 37: Data Table on AC - Year-over-year growth 2022-2027 (%)
- 6.4 DC - Market size and forecast 2022-2027
- Exhibit 38: Chart on DC - Market size and forecast 2022-2027 ($ million)
- Exhibit 39: Data Table on DC - Market size and forecast 2022-2027 ($ million)
- Exhibit 40: Chart on DC - Year-over-year growth 2022-2027 (%)
- Exhibit 41: Data Table on DC - Year-over-year growth 2022-2027 (%)
- 6.5 Market opportunity by Type
- Exhibit 42: Market opportunity by Type ($ million)
7 Market Segmentation by Application
- 7.1 Market segments
- Exhibit 43: Chart on Application - Market share 2022-2027 (%)
- Exhibit 44: Data Table on Application - Market share 2022-2027 (%)
- 7.2 Comparison by Application
- Exhibit 45: Chart on Comparison by Application
- Exhibit 46: Data Table on Comparison by Application
- 7.3 Public - Market size and forecast 2022-2027
- Exhibit 47: Chart on Public - Market size and forecast 2022-2027 ($ million)
- Exhibit 48: Data Table on Public - Market size and forecast 2022-2027 ($ million)
- Exhibit 49: Chart on Public - Year-over-year growth 2022-2027 (%)
- Exhibit 50: Data Table on Public - Year-over-year growth 2022-2027 (%)
- 7.4 Private - Market size and forecast 2022-2027
- Exhibit 51: Chart on Private - Market size and forecast 2022-2027 ($ million)
- Exhibit 52: Data Table on Private - Market size and forecast 2022-2027 ($ million)
- Exhibit 53: Chart on Private - Year-over-year growth 2022-2027 (%)
- Exhibit 54: Data Table on Private - Year-over-year growth 2022-2027 (%)
- 7.5 Market opportunity by Application
- Exhibit 55: Market opportunity by Application ($ million)
8 Customer Landscape
- 8.1 Customer landscape overview
- Exhibit 56: Analysis of price sensitivity, lifecycle, customer purchase basket, adoption rates, and purchase criteria
9 Geographic Landscape
- 9.1 Geographic segmentation
- Exhibit 57: Chart on Market share by geography 2022-2027 (%)
- Exhibit 58: Data Table on Market share by geography 2022-2027 (%)
- 9.2 Geographic comparison
- Exhibit 59: Chart on Geographic comparison
- Exhibit 60: Data Table on Geographic comparison
- 9.3 APAC - Market size and forecast 2022-2027
- Exhibit 61: Chart on APAC - Market size and forecast 2022-2027 ($ million)
- Exhibit 62: Data Table on APAC - Market size and forecast 2022-2027 ($ million)
- Exhibit 63: Chart on APAC - Year-over-year growth 2022-2027 (%)
- Exhibit 64: Data Table on APAC - Year-over-year growth 2022-2027 (%)
- 9.4 Europe - Market size and forecast 2022-2027
- Exhibit 65: Chart on Europe - Market size and forecast 2022-2027 ($ million)
- Exhibit 66: Data Table on Europe - Market size and forecast 2022-2027 ($ million)
- Exhibit 67: Chart on Europe - Year-over-year growth 2022-2027 (%)
- Exhibit 68: Data Table on Europe - Year-over-year growth 2022-2027 (%)
- 9.5 North America - Market size and forecast 2022-2027
- Exhibit 69: Chart on North America - Market size and forecast 2022-2027 ($ million)
- Exhibit 70: Data Table on North America - Market size and forecast 2022-2027 ($ million)
- Exhibit 71: Chart on North America - Year-over-year growth 2022-2027 (%)
- Exhibit 72: Data Table on North America - Year-over-year growth 2022-2027 (%)
- 9.6 South America - Market size and forecast 2022-2027
- Exhibit 73: Chart on South America - Market size and forecast 2022-2027 ($ million)
- Exhibit 74: Data Table on South America - Market size and forecast 2022-2027 ($ million)
- Exhibit 75: Chart on South America - Year-over-year growth 2022-2027 (%)
- Exhibit 76: Data Table on South America - Year-over-year growth 2022-2027 (%)
- 9.7 Middle East and Africa - Market size and forecast 2022-2027
- Exhibit 77: Chart on Middle East and Africa - Market size and forecast 2022-2027 ($ million)
- Exhibit 78: Data Table on Middle East and Africa - Market size and forecast 2022-2027 ($ million)
- Exhibit 79: Chart on Middle East and Africa - Year-over-year growth 2022-2027 (%)
- Exhibit 80: Data Table on Middle East and Africa - Year-over-year growth 2022-2027 (%)
- 9.8 China - Market size and forecast 2022-2027
- Exhibit 81: Chart on China - Market size and forecast 2022-2027 ($ million)
- Exhibit 82: Data Table on China - Market size and forecast 2022-2027 ($ million)
- Exhibit 83: Chart on China - Year-over-year growth 2022-2027 (%)
- Exhibit 84: Data Table on China - Year-over-year growth 2022-2027 (%)
- 9.9 US - Market size and forecast 2022-2027
- Exhibit 85: Chart on US - Market size and forecast 2022-2027 ($ million)
- Exhibit 86: Data Table on US - Market size and forecast 2022-2027 ($ million)
- Exhibit 87: Chart on US - Year-over-year growth 2022-2027 (%)
- Exhibit 88: Data Table on US - Year-over-year growth 2022-2027 (%)
- 9.10 Norway - Market size and forecast 2022-2027
- Exhibit 89: Chart on Norway - Market size and forecast 2022-2027 ($ million)
- Exhibit 90: Data Table on Norway - Market size and forecast 2022-2027 ($ million)
- Exhibit 91: Chart on Norway - Year-over-year growth 2022-2027 (%)
- Exhibit 92: Data Table on Norway - Year-over-year growth 2022-2027 (%)
- 9.11 Japan - Market size and forecast 2022-2027
- Exhibit 93: Chart on Japan - Market size and forecast 2022-2027 ($ million)
- Exhibit 94: Data Table on Japan - Market size and forecast 2022-2027 ($ million)
- Exhibit 95: Chart on Japan - Year-over-year growth 2022-2027 (%)
- Exhibit 96: Data Table on Japan - Year-over-year growth 2022-2027 (%)
- 9.12 Germany - Market size and forecast 2022-2027
- Exhibit 97: Chart on Germany - Market size and forecast 2022-2027 ($ million)
- Exhibit 98: Data Table on Germany - Market size and forecast 2022-2027 ($ million)
- Exhibit 99: Chart on Germany - Year-over-year growth 2022-2027 (%)
- Exhibit 100: Data Table on Germany - Year-over-year growth 2022-2027 (%)
- 9.13 Market opportunity by geography
- Exhibit 101: Market opportunity by geography ($ million)
10 Drivers, Challenges, and Trends
- 10.1 Market drivers
- 10.2 Market challenges
- 10.3 Impact of drivers and challenges
- Exhibit 102: Impact of drivers and challenges in 2022 and 2027
- 10.4 Market trends
11 Vendor Landscape
- 11.1 Overview
- 11.2 Vendor landscape
- Exhibit 103: Overview on Criticality of inputs and Factors of differentiation
- 11.3 Landscape disruption
- Exhibit 104: Overview on factors of disruption
- 11.4 Industry risks
- Exhibit 105: Impact of key risks on business
12 Vendor Analysis
- 12.1 Vendors covered
- Exhibit 106: Vendors covered
- 12.2 Market positioning of vendors
- Exhibit 107: Matrix on vendor position and classification
- 12.3 ABB Ltd.
- Exhibit 108: ABB Ltd. - Overview
- Exhibit 109: ABB Ltd. - Business segments
- Exhibit 110: ABB Ltd. - Key news
- Exhibit 111: ABB Ltd. - Key offerings
- Exhibit 112: ABB Ltd. - Segment focus
- 12.4 Aptiv PLC
- Exhibit 113: Aptiv PLC - Overview
- Exhibit 114: Aptiv PLC - Business segments
- Exhibit 115: Aptiv PLC - Key offerings
- Exhibit 116: Aptiv PLC - Segment focus
- 12.5 ChargePoint Inc.
- Exhibit 117: ChargePoint Inc. - Overview
- Exhibit 118: ChargePoint Inc. - Product / Service
- Exhibit 119: ChargePoint Inc. - Key news
- Exhibit 120: ChargePoint Inc. - Key offerings
- 12.6 Delta Electronics Inc.
- Exhibit 121: Delta Electronics Inc. - Overview
- Exhibit 122: Delta Electronics Inc. - Business segments
- Exhibit 123: Delta Electronics Inc. - Key offerings
- Exhibit 124: Delta Electronics Inc. - Segment focus
- 12.7 Eaton Corp. Plc
- Exhibit 125: Eaton Corp. Plc - Overview
- Exhibit 126: Eaton Corp. Plc - Business segments
- Exhibit 127: Eaton Corp. Plc - Key news
- Exhibit 128: Eaton Corp. Plc - Key offerings
- Exhibit 129: Eaton Corp. Plc - Segment focus
- 12.8 Enel Spa
- Exhibit 130: Enel Spa - Overview
- Exhibit 131: Enel Spa - Business segments
- Exhibit 132: Enel Spa - Key offerings
- Exhibit 133: Enel Spa - Segment focus
- 12.9 EV Safe Charge Inc
- Exhibit 134: EV Safe Charge Inc - Overview
- Exhibit 135: EV Safe Charge Inc - Product / Service
- Exhibit 136: EV Safe Charge Inc - Key offerings
- 12.10 FLO Services USA Inc.
- Exhibit 137: FLO Services USA Inc. - Overview
- Exhibit 138: FLO Services USA Inc. - Product / Service
- Exhibit 139: FLO Services USA Inc. - Key offerings
- 12.11 Kempower Oy
- Exhibit 140: Kempower Oy - Overview
- Exhibit 141: Kempower Oy - Product / Service
- Exhibit 142: Kempower Oy - Key news
- Exhibit 143: Kempower Oy - Key offerings
- 12.12 Lectron EV
- Exhibit 144: Lectron EV - Overview
- Exhibit 145: Lectron EV - Product / Service
- Exhibit 146: Lectron EV - Key offerings
- 12.13 Robert Bosch GmbH
- Exhibit 147: Robert Bosch GmbH - Overview
- Exhibit 148: Robert Bosch GmbH - Business segments
- Exhibit 149: Robert Bosch GmbH - Key offerings
- Exhibit 150: Robert Bosch GmbH - Segment focus
- 12.14 Schneider Electric SE
- Exhibit 151: Schneider Electric SE - Overview
- Exhibit 152: Schneider Electric SE - Business segments
- Exhibit 153: Schneider Electric SE - Key news
- Exhibit 154: Schneider Electric SE - Key offerings
- Exhibit 155: Schneider Electric SE - Segment focus
- 12.15 Shanghai Mida EV Power Co. Ltd.
- Exhibit 156: Shanghai Mida EV Power Co. Ltd. - Overview
- Exhibit 157: Shanghai Mida EV Power Co. Ltd. - Product / Service
- Exhibit 158: Shanghai Mida EV Power Co. Ltd. - Key offerings
- 12.16 Shanghai Zencar Industry Co Ltd
- Exhibit 159: Shanghai Zencar Industry Co Ltd - Overview
- Exhibit 160: Shanghai Zencar Industry Co Ltd - Product / Service
- Exhibit 161: Shanghai Zencar Industry Co Ltd - Key offerings
- 12.17 Siemens AG
- Exhibit 162: Siemens AG - Overview
- Exhibit 163: Siemens AG - Business segments
- Exhibit 164: Siemens AG - Key news
- Exhibit 165: Siemens AG - Key offerings
- Exhibit 166: Siemens AG - Segment focus
13 Appendix
- 13.1 Scope of the report
- 13.2 Inclusions and exclusions checklist
- Exhibit 167: Inclusions checklist
- Exhibit 168: Exclusions checklist
- 13.3 Currency conversion rates for US$
- Exhibit 169: Currency conversion rates for US$
- 13.4 Research methodology
- Exhibit 170: Research methodology
- Exhibit 171: Validation techniques employed for market sizing
- Exhibit 172: Information sources
- 13.5 List of abbreviations
- Exhibit 173: List of abbreviations
About Us
Technavio is a leading global technology research and advisory company. Their research and analysis focus on emerging market trends and provide actionable insights to help businesses identify market opportunities and develop effective strategies to optimize their market positions. With over 500 specialized analysts, Technavio's report library consists of more than 17,000 reports and counting, covering 800 technologies, spanning across 50 countries. Their client base consists of enterprises of all sizes, including more than 100 Fortune 500 companies. This growing client base relies on Technavio's comprehensive coverage, extensive research, and actionable market insights to identify opportunities in existing and potential markets and assess their competitive positions within changing market scenarios.