EIA This Week In Petroleum
In 2021, U.S. ethane consumption grew by 3%, reaching a new record high. Annual U.S. ethane consumption has increased every year since 2008 because demand for ethane as a petrochemical feedstock has been growing. We forecast this trend to continue through 2023 in our March STEO (Figure 2). Ethane mainly serves as a petrochemical feedstock to produce ethylene, which is used to make plastics and resins. When cracking ethane produces ethylene, ethane and steam are fed into a cracker that heats the mixture to break down (or crack) the ethane molecule, resulting in a product stream composed primarily of ethylene, along with some co-products.
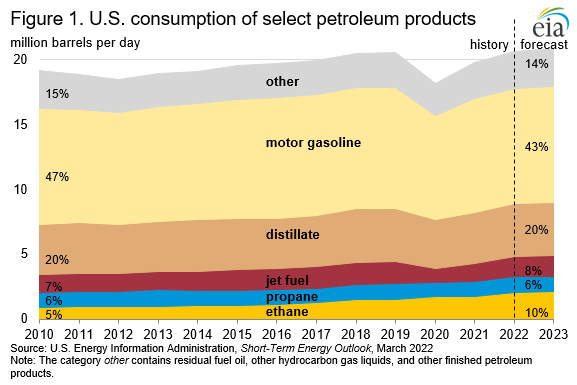
U.S. ethane consumption growth to outpace growth in all other petroleum products through 2023
U.S. ethane consumption has grown every year since 2008, outpacing consumption growth for all other petroleum products. Ethane consumption, which we report as product supplied, grew by 50,000 barrels per day (b/d) in 2021, according to preliminary data from our February 2022 Petroleum Supply Monthly. We forecast in our March 2022 Short-Term Energy Outlook (STEO) that by 2023, ethane will account for 10% of U.S. petroleum product demand, up from 5% in 2010 (Figure 1). In 2020, two ethylene crackers expanded capacity in the United States, and in 2021, two new ethylene crackers started. Domestic ethane consumption over the past two years has increased as a result of increased ethylene cracking capacity; by contrast, consumption of transportation fuels has decreased as a result of the COVID-19 pandemic.
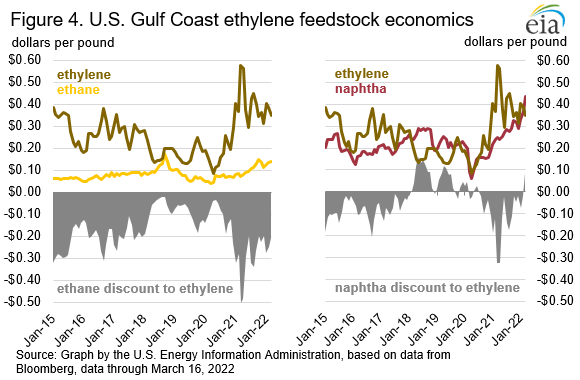
A variety of feedstocks can be used to produce ethylene in petrochemical crackers, including all natural gas plant liquids (NGPL) and naphtha. Ethane spot prices are associated more with natural gas than crude oil, making ethane a cheaper feedstock than naphtha (Figure 4). • Naphtha and heavier NGPL such as butanes and natural gasoline are more closely associated with crude oil. Ethane spot prices have been consistently lower than naphtha spot prices. Since the beginning of 2022, average monthly naphtha prices have been above $0.30 per pound as a result of the higher price of crude oil. Ethane, however, has stayed below $0.20 per pound for more than a decade.
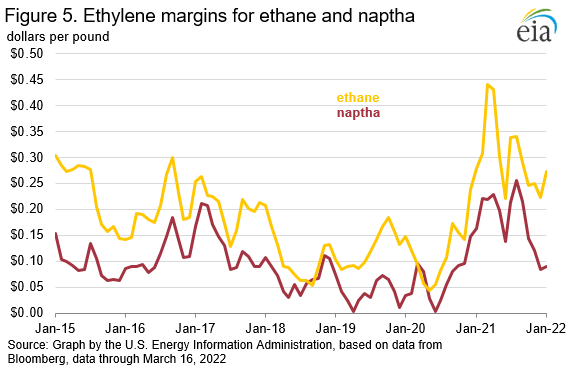
In the United States, cracking ethane has a higher margin than naphtha for ethylene production, which remains in high demand globally as an input into producing resins and plastics (Figure 5). Cracking ethane can yield more than 80% ethylene, while cracking naphtha can yield as little as 30% ethylene. Low relative cost, a high ethylene yield, and little co-product have spurred ethane use to grow as an ethylene feedstock in the United States and, increasingly, around the world. Although naphtha cracking can yield valuable co-products such as propylene, butadiene, benzene, toluene and xylene, demand for ethylene is outpacing demand for other co-products, reducing the appeal of naphtha cracking.
The United States also exports ethane, which began in 2014 via pipeline to Canada and then by tanker to several other countries starting in 2016. U.S. ethane exports to China quadrupled between 2020 and 2021 after Zhejiang Satellite Petrochemical Co Ltd completed its petrochemical cracker in Lianyungang, China, and Energy Transfer completed the Orbit marine export terminal in Nederland, Texas. The first U.S. ethane shipment from the Orbit terminal arrived in China in mid-February 2022 on the first of six Very Large Ethane Carriers (VLECs) that went into service in 2021, each capable of carrying more than 900,000 barrels of liquefied ethane. This delivery came as part of a contractual agreement between Satellite Petrochemical and Energy Transfer. A second petrochemical cracker is expected to come online in the second half of 2022, doubling the total feed capacity at the Satellite Petrochemical site to 150,000 b/d of imported ethane from the United States, along with six additional VLECs scheduled for delivery in the second half of 2022. We forecast that U.S. ethane exports will reach 470,000 b/d by 2023, primarily because Satellite Petrochemical’s second cracker will reach full operational capacity in 2023.
Norway is the only other country capable of exporting ethane, usually on smaller vessels to serve terminals around the North Sea. When natural gas prices in northwestern Europe rose to record highs beginning in the fourth quarter of 2021, less ethane was removed from the natural gas stream to increase the energy content of natural gas (this is known as ethane rejection), effectively increasing the volume and heat content of natural gas Norway could export to the rest of Europe. As a result, Norway’s waterborne ethane exports halted for several months in the second half of 2021. For the first time since 2017, U.S. ethane was exported to Antwerp, Belgium, substituting for the lost supplies from Norway.
For questions about This Week in Petroleum, contact the Petroleum and Liquid Fuels Markets Team at 202-586-5840.
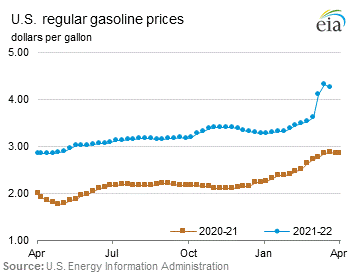
Retail prices (dollars per gallon)

| Click to chart this seriesU.S. |
4.239 |
-0.076down-arrow |
1.374up-arrow |
| Click to chart this seriesEast Coast |
4.127 |
-0.141down-arrow |
1.320up-arrow |
| Click to chart this seriesMidwest |
4.035 |
-0.056down-arrow |
1.292up-arrow |
| Click to chart this seriesGulf Coast |
3.939 |
-0.090down-arrow |
1.316up-arrow |
| Click to chart this seriesRocky Mountain |
4.110 |
-0.027down-arrow |
1.172up-arrow |
| Click to chart this seriesWest Coast |
5.222 |
0.067up-arrow |
1.754up-arrow |
| Click to chart this seriesU.S. |
5.134 |
-0.116down-arrow |
1.940up-arrow |
| Click to chart this seriesEast Coast |
5.179 |
-0.155down-arrow |
2.027up-arrow |
| Click to chart this seriesMidwest |
4.959 |
-0.085down-arrow |
1.810up-arrow |
| Click to chart this seriesGulf Coast |
4.964 |
-0.146down-arrow |
1.973up-arrow |
| Click to chart this seriesRocky Mountain |
4.887 |
-0.079down-arrow |
1.570up-arrow |
| Click to chart this seriesWest Coast |
5.797 |
-0.070down-arrow |
2.119up-arrow |
| Click to chart this seriesHeating Oil |
4.872 |
-0.063down-arrow |
1.992up-arrow |
| Click to chart this seriesPropane |
2.983 |
-0.036down-arrow |
0.661up-arrow |
-
Futures prices (dollars per gallon*)
| Click to chart this seriesCrude oil |
104.70 |
-4.63down-arrow |
43.28up-arrow |
| Click to chart this seriesGasoline |
3.239 |
-0.073down-arrow |
1.296up-arrow |
| Click to chart this seriesHeating oil |
3.598 |
0.180up-arrow |
1.776up-arrow |
| Click to chart this seriesCrude oil |
413.4 |
-2.5down-arrow |
-89.3down-arrow |
| Click to chart this seriesGasoline |
238.0 |
-2.9down-arrow |
5.8up-arrow |
| Click to chart this seriesDistillate |
112.1 |
-2.1down-arrow |
-29.4down-arrow |
| Click to chart this seriesPropane |
33.564 |
0.256up-arrow |
-7.705down-arrow |