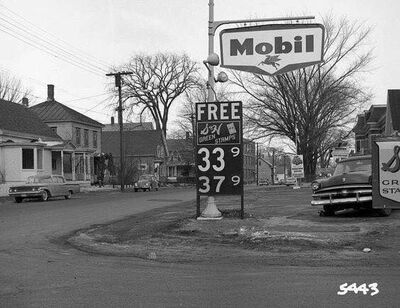
Gasoline Consumption Per Capita - 2020 On Par With 1965 Priced At Adjusted $2.54 Per Gallon
Special To The Auto Channel
From Green Car Congress
Written By Michael Sivak, Sivak Applied Research.
Because of the pandemic, there was a substantial reduction in 2020 in vehicle miles traveled. The biggest drop was in April 2020 (a reduction of 40% compared with April 2019) followed by a gradual rebound later in the year. In December 2020, the reduction was 11% compared with December 2019. Overall, vehicle miles traveled in 2020 were down 13% compared with 2019.
This analysis examines the effect of this downturn in driving on gasoline consumption (both total and per capita), and places the consumption in 2020 in a historical context. The results show that gasoline consumption per capita in 2020 was on par with that 55 years ago.
Total consumption
Total gasoline consumption for highway use dropped from 136,076 million gallons in 2019 to 117,251 million gallons in 2020, a drop of 14%. The last time the total consumption was lower than in 2020 was in 1995. Therefore, the table below shows the annual consumptions between 1995 and 2020. (The maximum—136,468 million gallons—was reached in 2014.)
| Year | Total consumption (millions of gallons) | Year | Total consumption (millions of gallons) |
| 1995 | 117,061 | 2008 | 132,254 |
| 1996 | 119,515 | 2009 | 132,297 |
| 1997 | 120,938 | 2010 | 133,725 |
| 1998 | 124,694 | 2011 | 131,274 |
| 1999 | 128,743 | 2012 | 130,935 |
| 2000 | 128,884 | 2013 | 131,299 |
| 2001 | 129,682 | 2014 | 136,468 |
| 2002 | 132,955 | 2015 | 132,243 |
| 2003 | 134,634 | 2016 | 135,559 |
| 2004 | 136,455 | 2017 | 135,301 |
| 2005 | 135,176 | 2018 | 135,337 |
| 2006 | 134,836 | 2019 | 136,076 |
| 2007 | 135,418 | 2020 | 117,251 |
Consumption per capita
Gasoline consumption per capita was calculated using the population estimates in the ProQuest Statistical Abstract of the United States. Consumption per capita dropped from 414 gallons in 2019 to 356 gallons in 2020, again a drop of 14%. The last time the consumption per capita was lower than in 2020 was in 1965. Therefore, the table below shows the consumptions per capita for selected years between 1965 and 2020.
| Year | Consumption per capita (gallons) | Year | Consumption per capita (gallons) |
| 1965 | 346 | 2000 | 457 |
| 1966 | 358 | 2010 | 432 |
| 1967 | 368 | 2011 | 421 |
| 1968 | 387 | 2012 | 417 |
| 1969 | 406 | 2013 | 415 |
| 1970 | 420 | 2014 | 429 |
| 1976 | 483 | 2015 | 412 |
| 1977 | 491 | 2016 | 420 |
| 1978 | 505 | 2017 | 416 |
| 1979 | 481 | 2018 | 414 |
| 1980 | 445 | 2019 | 414 |
| 1990 | 439 | 2020 | 356 |
The maximum consumption per capita (505 gallons) was reached in 1978. Not coincidentally, the first Corporate Average Fuel Economy (CAFE) standards for new cars and light trucks became effective with 1978 model-year vehicles.
Michael Sivak is the managing director of Sivak Applied Research and the former director of Sustainable Worldwide Transportation at the University of Michigan.


