

Sonic Automotive Reports Record First Quarter Revenues and Earnings Per Share
 |
CHARLOTTE, N.C.--Sonic Automotive, Inc. (“Sonic” or the “Company”) , one of the nation’s largest automotive retailers, today reported financial results for the first quarter ended March 31, 2021. The financial measures discussed below are results for the first quarter of 2021 with comparisons made to the first quarter of 2020, unless otherwise noted. Certain metrics are also compared to the first quarter of 2019 to exclude the effects of the onset of the COVID-19 pandemic on comparative results.
First Quarter Highlights
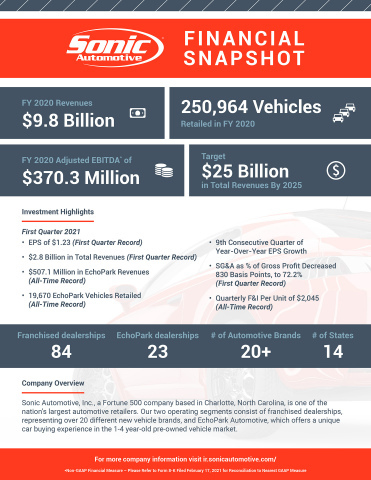
- Record first quarter revenues of $2.8 billion, up 20.7%, and record first quarter income from continuing operations before taxes of $72.6 million, compared to a loss before taxes of $243.2 million in the first quarter of 2020, which included a $268.0 million non-cash goodwill impairment charge (excluding the effect of this prior year goodwill impairment charge, pre-tax earnings increased 193.1%)
- Record first quarter reported earnings from continuing operations of $53.7 million ($1.23 per diluted share), compared to a loss of $199.1 million (loss of $4.67 per diluted share) and adjusted earnings from continuing operations* of $17.6 million ($0.40 per diluted share) in the first quarter of 2020
- Record first quarter selling, general and administrative (“SG&A”) expenses as a percentage of gross profit of 72.2%, a decrease of 830 basis points from 80.5% in the first quarter of 2020
- All-time record quarterly total Finance & Insurance (“F&I”) gross profit per retail unit of $2,045, up 8.5%
- Reported EchoPark results include:
- All-time record quarterly EchoPark revenues of $507.1 million, up 52.9%
- All-time record quarterly EchoPark retail sales volume of 19,670, up 40.6%
- EchoPark pre-tax earnings of $2.0 million and Adjusted EBITDA* of $6.2 million
- Same store Franchised Dealerships Segment operating results include:
- Revenues up 16.4%, gross profit up 11.1% (up 13.9% and 12.3%, respectively, compared to the first quarter of 2019)
- New vehicle unit sales volume up 13.8% (up 7.5% compared to the first quarter of 2019); new vehicle gross profit per unit up 34.3%, to $2,831 (up 25.4% compared to the first quarter of 2019)
- Retail used vehicle unit sales volume up 6.2% (up 8.6% compared to the first quarter of 2019); retail used vehicle gross profit per unit down 11.3%, to $1,111 (down 13.0% compared to the first quarter of 2019)
- Parts, service and collision repair gross profit down 1.8% (up 0.1% compared to the first quarter of 2019); customer pay gross profit up 1.6% (up 6.8% compared to the first quarter of 2019); gross margin up 150 basis points, to 50.2% (up 180 basis points compared to the first quarter of 2019)
- F&I gross profit up 18.7% (up 27.4% compared to the first quarter of 2019); reported Franchised Dealerships Segment F&I gross profit per retail unit of $1,910, up 8.5% (up 24.1% compared to the first quarter of 2019)
- Sonic’s Board of Directors approved a 20% increase to the Company’s quarterly cash dividend, to $0.12 per share, payable on July 15, 2021 to all stockholders of record on June 15, 2021
- Sonic’s Board of Directors increased the Company’s share repurchase authorization by $250.0 million, to a total of $277.3 million of available authorization
Commentary
David Smith, Sonic’s and EchoPark’s Chief Executive Officer, commented, “Fiscal 2020 was a record-setting year from an adjusted earnings perspective, and this momentum has continued into 2021, where we generated record first quarter revenues and earnings driven by strong performance in both our franchised dealerships and EchoPark segments. EchoPark continues to set new records, achieving better than projected all-time record quarterly revenues and retail sales volume. The first quarter results at both our franchised dealerships and EchoPark stores reflect a strong demand environment which has persisted into the second quarter of 2021 to date. We remain confident in our goal of more than doubling total revenues to $25.0 billion by 2025, while also substantially improving our expected profitability as we continue to apply the efficiencies we have realized over the past year.”
Jeff Dyke, Sonic’s and EchoPark’s President, commented, “We believe EchoPark’s swift growth demonstrates the long-term value proposition of this unique, pre-owned vehicle shopping concept, as a growing number of guests visit us in-store and online at EchoPark.com for the exceptional pricing, diverse inventory selection and guest-centric buying experience we offer. At the same time, we continue to develop our digital retail and delivery model, enabling consumers to purchase their next vehicle in an efficient way best tailored to their needs. With recent store openings in Phoenix, Arizona and Birmingham, Alabama, in addition to opening our latest delivery center in Charleston, South Carolina just last week, we remain committed to reaching a 140-point nationwide distribution network by 2025, which we expect to retail over half a million pre-owned vehicles annually by that time. With our progress to date, we believe we are well on track to reach $14.0 billion in EchoPark revenues by 2025.”
Heath Byrd, Sonic’s and EchoPark’s Chief Financial Officer, commented, “During the first quarter, we continued our commitment to fundamentally improving operating efficiencies and managing expenses throughout our entire organization, reducing SG&A expenses as a percentage of gross profit by 830 basis points compared to the first quarter of 2020. At the same time, we took steps to further strengthen our balance sheet position by replacing our existing revolving and floor plan facilities with a new four-year, $1.8 billion revolving and floor plan credit facility. The credit facility was substantially oversubscribed, with strong support from both new and incumbent financial institutions. We are very pleased with this transaction, which has extended our debt maturities, improved our borrowing costs and increased our total available liquidity and floor plan capacity to facilitate our growth plans.”
*Adjusted earnings from continuing operations, adjusted earnings per diluted share from continuing operations and Adjusted EBITDA are non-GAAP financial measures. The tables included in this press release reconcile these non-GAAP financial measures to the most directly comparable GAAP financial measures.
Dividend
Sonic’s Board of Directors approved a quarterly cash dividend of $0.12 per share payable on July 15, 2021 to all stockholders of record on June 15, 2021.
First Quarter 2021 Earnings Conference Call
Senior management will hold a conference call on Thursday, April 29, 2021 at 11:00 A.M. (Eastern). Investor presentation and earnings press release materials will be accessible beginning the morning of the conference call on the Company’s website at ir.sonicautomotive.com.
To access the live webcast, please go to ir.sonicautomotive.com. For telephone access to this conference call, please register in advance using this link: http://www.directeventreg.com/registration/event/1090549. After registering, you will receive a confirmation email that includes dial-in numbers and unique conference call and registrant passcodes for entry. Registration remains available through the live call, however, to ensure you are connected for the full call we suggest registering at least 10 minutes before the start of the call.
A conference call replay will be available one hour following the call for 14 days at ir.sonicautomotive.com.
About Sonic Automotive
Sonic Automotive, Inc., a Fortune 500 company based in Charlotte, North Carolina, is one of the nation’s largest automotive retailers. Sonic can be reached on the web at www.sonicautomotive.com.
About EchoPark Automotive
EchoPark Automotive is a growing operating segment within the Company that specializes in pre-owned vehicle sales and provides a unique guest experience unlike traditional used car stores. More information about EchoPark Automotive can be found at www.echopark.com.
Forward-Looking Statements
Included herein are forward-looking statements, including statements regarding anticipated future revenue levels, future profitability, projected SG&A expense levels, pre-owned vehicle sales projections and the opening of additional EchoPark points. There are many factors that affect management’s views about future events and trends of the Company’s business. These factors involve risks and uncertainties that could cause actual results or trends to differ materially from management’s views, including, without limitation, economic conditions in the markets in which we operate, new and used vehicle industry sales volume, anticipated future growth in our EchoPark Segment, the success of our operational strategies, the rate and timing of overall economic expansion or contraction, the effect of the COVID-19 pandemic and related government-imposed restrictions on operations, and the risk factors described in the Company’s Annual Report on Form 10-K for the year ended December 31, 2020 and other reports and information filed with the Securities and Exchange Commission (the “SEC”). The Company does not undertake any obligation to update forward-looking information, except as required under federal securities laws and the rules and regulations of the SEC.
Non-GAAP Financial Measures
This press release and the attached financial tables contain certain non-GAAP financial measures as defined under SEC rules, such as adjusted earnings from continuing operations, adjusted earnings per diluted share from continuing operations, and Adjusted EBITDA. As required by SEC rules, the Company has provided reconciliations of these non-GAAP financial measures to the most directly comparable GAAP financial measures in the schedules included in this press release. The Company believes that these non-GAAP financial measures improve the transparency of the Company’s disclosures and provide a meaningful presentation of the Company’s results.
|
Sonic Automotive, Inc. |
||||||||||
|
Results of Operations (Unaudited) |
||||||||||
|
Results of Operations - Consolidated |
||||||||||
|
|
Three Months Ended March 31, |
|
Better / (Worse) |
|||||||
|
|
2021 |
|
2020 |
|
% Change |
|||||
|
|
(In thousands, except per share amounts) |
|||||||||
|
Revenues: |
|
|
|
|
|
|||||
|
New vehicles |
$ |
1,156,317 |
|
|
$ |
959,489 |
|
|
20.5 |
% |
|
Used vehicles |
1,090,097 |
|
|
850,052 |
|
|
28.2 |
% |
||
|
Wholesale vehicles |
74,809 |
|
|
48,543 |
|
|
54.1 |
% |
||
|
Total vehicles |
2,321,223 |
|
|
1,858,084 |
|
|
24.9 |
% |
||
|
Parts, service and collision repair |
320,914 |
|
|
334,680 |
|
|
(4.1) |
% |
||
|
Finance, insurance and other, net |
144,661 |
|
|
115,292 |
|
|
25.5 |
% |
||
|
Total revenues |
2,786,798 |
|
|
2,308,056 |
|
|
20.7 |
% |
||
|
Cost of sales: |
|
|
|
|
|
|||||
|
New vehicles |
(1,086,852) |
|
|
(914,074) |
|
|
(18.9) |
% |
||
|
Used vehicles |
(1,059,229) |
|
|
(817,922) |
|
|
(29.5) |
% |
||
|
Wholesale vehicles |
(73,960) |
|
|
(48,700) |
|
|
(51.9) |
% |
||
|
Total vehicles |
(2,220,041) |
|
|
(1,780,696) |
|
|
(24.7) |
% |
||
|
Parts, service and collision repair |
(165,864) |
|
|
(176,782) |
|
|
6.2 |
% |
||
|
Total cost of sales |
(2,385,905) |
|
|
(1,957,478) |
|
|
(21.9) |
% |
||
|
Gross profit |
400,893 |
|
|
350,578 |
|
|
14.4 |
% |
||
|
Selling, general and administrative expenses |
(289,356) |
|
|
(282,156) |
|
|
(2.6) |
% |
||
|
Impairment charges |
— |
|
|
(268,000) |
|
|
100.0 |
% |
||
|
Depreciation and amortization |
(23,687) |
|
|
(22,297) |
|
|
(6.2) |
% |
||
|
Operating income (loss) |
87,850 |
|
|
(221,875) |
|
|
139.6 |
% |
||
|
Other income (expense): |
|
|
|
|
|
|||||
|
Interest expense, floor plan |
(5,113) |
|
|
(10,508) |
|
|
51.3 |
% |
||
|
Interest expense, other, net |
(10,285) |
|
|
(10,965) |
|
|
6.2 |
% |
||
|
Other income (expense), net |
101 |
|
|
100 |
|
|
1.0 |
% |
||
|
Total other income (expense) |
(15,297) |
|
|
(21,373) |
|
|
28.4 |
% |
||
|
Income (loss) from continuing operations before taxes |
72,553 |
|
|
(243,248) |
|
|
129.8 |
% |
||
|
Provision for income taxes for continuing operations - benefit (expense) |
(18,864) |
|
|
44,117 |
|
|
(142.8) |
% |
||
|
Income (loss) from continuing operations |
53,689 |
|
|
(199,131) |
|
|
127.0 |
% |
||
|
Discontinued operations: |
|
|
|
|
|
|||||
|
Income (loss) from discontinued operations before taxes |
720 |
|
|
(285) |
|
|
352.6 |
% |
||
|
Provision for income taxes for discontinued operations - benefit (expense) |
(187) |
|
|
83 |
|
|
(325.3) |
% |
||
|
Income (loss) from discontinued operations |
533 |
|
|
(202) |
|
|
363.9 |
% |
||
|
Net income (loss) |
$ |
54,222 |
|
|
$ |
(199,333) |
|
|
127.2 |
% |
|
Basic earnings (loss) per common share: |
|
|
|
|
|
|||||
|
Earnings (loss) per share from continuing operations |
$ |
1.29 |
|
|
$ |
(4.67) |
|
|
127.6 |
% |
|
Earnings (loss) per share from discontinued operations |
0.02 |
|
|
(0.01) |
|
|
300.0 |
% |
||
|
Earnings (loss) per common share |
$ |
1.31 |
|
|
$ |
(4.68) |
|
|
128.0 |
% |
|
Weighted-average common shares outstanding |
41,541 |
|
|
42,615 |
|
|
2.5 |
% |
||
|
Diluted earnings (loss) per common share: |
|
|
|
|
|
|||||
|
Earnings (loss) per share from continuing operations |
$ |
1.23 |
|
|
$ |
(4.67) |
|
|
126.3 |
% |
|
Earnings (loss) per share from discontinued operations |
0.02 |
|
|
(0.01) |
|
|
300.0 |
% |
||
|
Earnings (loss) per common share |
$ |
1.25 |
|
|
$ |
(4.68) |
|
|
126.7 |
% |
|
Weighted-average common shares outstanding |
43,542 |
|
|
42,615 |
|
|
(2.2) |
% |
||
|
Dividends declared per common share |
$ |
0.10 |
|
|
$ |
0.10 |
|
|
— |
% |
Franchised Dealerships Segment - Reported
|
|
Three Months Ended March 31, |
|
Better / (Worse) |
|||||||
|
|
2021 |
|
2020 |
|
% Change |
|||||
|
|
(In thousands, except unit and per unit data) |
|||||||||
|
Revenues: |
|
|
|
|
|
|||||
|
New vehicles |
$ |
1,156,317 |
|
|
$ |
959,489 |
|
|
20.5 |
% |
|
Used vehicles |
661,534 |
|
|
566,888 |
|
|
16.7 |
% |
||
|
Wholesale vehicles |
56,204 |
|
|
42,440 |
|
|
32.4 |
% |
||
|
Total vehicles |
1,874,055 |
|
|
1,568,817 |
|
|
19.5 |
% |
||
|
Parts, service and collision repair |
308,077 |
|
|
324,501 |
|
|
(5.1) |
% |
||
|
Finance, insurance and other, net |
97,525 |
|
|
83,029 |
|
|
17.5 |
% |
||
|
Total revenues |
2,279,657 |
|
|
1,976,347 |
|
|
15.3 |
% |
||
|
Gross Profit: |
|
|
|
|
|
|||||
|
New vehicles |
69,465 |
|
|
45,415 |
|
|
53.0 |
% |
||
|
Used vehicles |
31,996 |
|
|
32,314 |
|
|
(1.0) |
% |
||
|
Wholesale vehicles |
736 |
|
|
(83) |
|
|
986.7 |
% |
||
|
Total vehicles |
102,197 |
|
|
77,646 |
|
|
31.6 |
% |
||
|
Parts, service and collision repair |
155,265 |
|
|
158,096 |
|
|
(1.8) |
% |
||
|
Finance, insurance and other, net |
97,525 |
|
|
83,029 |
|
|
17.5 |
% |
||
|
Total gross profit |
354,987 |
|
|
318,771 |
|
|
11.4 |
% |
||
|
Selling, general and administrative expenses |
(250,076) |
|
|
(256,418) |
|
|
2.5 |
% |
||
|
Impairment charges |
— |
|
|
(268,000) |
|
|
NM |
|||
|
Depreciation and amortization |
(20,376) |
|
|
(19,589) |
|
|
(4.0) |
% |
||
|
Operating income (loss) |
84,535 |
|
|
(225,236) |
|
|
137.5 |
% |
||
|
Other income (expense): |
|
|
|
|
|
|||||
|
Interest expense, floor plan |
(4,117) |
|
|
(9,608) |
|
|
57.2 |
% |
||
|
Interest expense, other, net |
(9,958) |
|
|
(10,599) |
|
|
6.0 |
% |
||
|
Other income (expense), net |
83 |
|
|
99 |
|
|
(16.2) |
% |
||
|
Total other income (expense) |
(13,992) |
|
|
(20,108) |
|
|
30.4 |
% |
||
|
Income (loss) before taxes |
70,543 |
|
|
(245,344) |
|
|
128.8 |
% |
||
|
Add: impairment charges |
— |
|
|
268,000 |
|
|
NM |
|||
|
Segment income (loss) |
$ |
70,543 |
|
|
$ |
22,656 |
|
|
211.4 |
% |
|
|
|
|
|
|
|
|||||
|
Unit Sales Volume: |
|
|
|
|
|
|||||
|
New vehicles |
24,358 |
|
|
21,724 |
|
|
12.1 |
% |
||
|
Used vehicles |
27,236 |
|
|
26,038 |
|
|
4.6 |
% |
||
|
Wholesale vehicles |
6,832 |
|
|
6,910 |
|
|
(1.1) |
% |
||
|
Retail new & used vehicles |
51,594 |
|
|
47,762 |
|
|
8.0 |
% |
||
|
Used-to-New Ratio |
1.12 |
|
|
1.20 |
|
|
(6.7) |
% |
||
|
|
|
|
|
|
|
|||||
|
Gross Profit Per Unit: |
|
|
|
|
|
|||||
|
New vehicles |
$ |
2,852 |
|
|
$ |
2,091 |
|
|
36.4 |
% |
|
Used vehicles |
$ |
1,175 |
|
|
$ |
1,241 |
|
|
(5.3) |
% |
|
Finance, insurance and other, net |
$ |
1,910 |
|
|
$ |
1,760 |
|
|
8.5 |
% |
|
NM = Not Meaningful |
||||||||||
Franchised Dealerships Segment - Same Store
|
|
Three Months Ended March 31, |
|
Better / (Worse) |
|||||||
|
|
2021 |
|
2020 |
|
% Change |
|||||
|
|
(In thousands, except unit and per unit data) |
|||||||||
|
Revenues: |
|
|
|
|
|
|||||
|
New vehicles |
$ |
1,156,317 |
|
|
$ |
950,589 |
|
|
21.6 |
% |
|
Used vehicles |
661,534 |
|
|
560,796 |
|
|
18.0 |
% |
||
|
Wholesale vehicles |
56,204 |
|
|
42,103 |
|
|
33.5 |
% |
||
|
Total vehicles |
1,874,055 |
|
|
1,553,488 |
|
|
20.6 |
% |
||
|
Parts, service and collision repair |
306,190 |
|
|
321,295 |
|
|
(4.7) |
% |
||
|
Finance, insurance and other, net |
92,246 |
|
|
77,692 |
|
|
18.7 |
% |
||
|
Total revenues |
$ |
2,272,491 |
|
|
$ |
1,952,475 |
|
|
16.4 |
% |
|
Gross Profit: |
|
|
|
|
|
|||||
|
New vehicles |
$ |
68,956 |
|
|
$ |
45,115 |
|
|
52.8 |
% |
|
Used vehicles |
30,273 |
|
|
32,141 |
|
|
(5.8) |
% |
||
|
Wholesale vehicles |
736 |
|
|
(49) |
|
|
1,602.0 |
% |
||
|
Total vehicles |
99,965 |
|
|
77,207 |
|
|
29.5 |
% |
||
|
Parts, service and collision repair |
153,682 |
|
|
156,465 |
|
|
(1.8) |
% |
||
|
Finance, insurance and other, net |
92,246 |
|
|
77,692 |
|
|
18.7 |
% |
||
|
Total gross profit |
$ |
345,893 |
|
|
$ |
311,364 |
|
|
11.1 |
% |
|
|
|
|
|
|
|
|||||
|
Unit Sales Volume: |
|
|
|
|
|
|||||
|
New vehicles |
24,358 |
|
|
21,410 |
|
|
13.8 |
% |
||
|
Used vehicles |
27,236 |
|
|
25,635 |
|
|
6.2 |
% |
||
|
Wholesale vehicles |
6,832 |
|
|
6,838 |
|
|
(0.1) |
% |
||
|
Retail new & used vehicles |
51,594 |
|
|
47,045 |
|
|
9.7 |
% |
||
|
Used-to-New Ratio |
1.12 |
|
|
1.20 |
|
|
(6.6) |
% |
||
|
|
|
|
|
|
|
|||||
|
Gross Profit Per Unit: |
|
|
|
|
|
|||||
|
New vehicles |
$ |
2,831 |
|
|
$ |
2,107 |
|
|
34.4 |
% |
|
Used vehicles |
$ |
1,112 |
|
|
$ |
1,254 |
|
|
(11.3) |
% |
|
Finance, insurance and other, net |
$ |
1,807 |
|
|
$ |
1,672 |
|
|
8.1 |
% |
|
Note: All currently operating franchised dealership stores are included within the same store group as of the first full month following the first anniversary of the store’s opening or acquisition. |
||||||||||
EchoPark Segment - Reported
|
|
Three Months Ended March 31, |
|
Better / (Worse) |
|||||||
|
|
2021 |
|
2020 |
|
% Change |
|||||
|
|
(In thousands, except unit and per unit data) |
|||||||||
|
Revenues: |
|
|
|
|
|
|||||
|
Used vehicles |
$ |
428,563 |
|
|
$ |
283,164 |
|
|
51.3 |
% |
|
Wholesale vehicles |
18,605 |
|
|
6,103 |
|
|
204.9 |
% |
||
|
Total vehicles |
447,168 |
|
|
289,267 |
|
|
54.6 |
% |
||
|
Parts, service and collision repair |
12,837 |
|
|
10,179 |
|
|
26.1 |
% |
||
|
Finance, insurance and other, net |
47,136 |
|
|
32,263 |
|
|
46.1 |
% |
||
|
Total revenues |
507,141 |
|
|
331,709 |
|
|
52.9 |
% |
||
|
Gross Profit: |
|
|
|
|
|
|||||
|
Used vehicles |
(1,128) |
|
|
(184) |
|
|
(513.0) |
% |
||
|
Wholesale vehicles |
113 |
|
|
(74) |
|
|
252.7 |
% |
||
|
Total vehicles |
(1,015) |
|
|
(258) |
|
|
(293.4) |
% |
||
|
Parts, service and collision repair |
(215) |
|
|
(198) |
|
|
(8.6) |
% |
||
|
Finance, insurance and other, net |
47,136 |
|
|
32,263 |
|
|
46.1 |
% |
||
|
Total gross profit |
45,906 |
|
|
31,807 |
|
|
44.3 |
% |
||
|
Selling, general and administrative expenses |
(39,280) |
|
|
(25,738) |
|
|
(52.6) |
% |
||
|
Impairment charges |
— |
|
|
— |
|
|
— |
% |
||
|
Depreciation and amortization |
(3,311) |
|
|
(2,708) |
|
|
(22.3) |
% |
||
|
Operating income (loss) |
3,315 |
|
|
3,361 |
|
|
(1.4) |
% |
||
|
Other income (expense): |
|
|
|
|
|
|||||
|
Interest expense, floor plan |
(996) |
|
|
(900) |
|
|
(10.7) |
% |
||
|
Interest expense, other, net |
(327) |
|
|
(366) |
|
|
10.7 |
% |
||
|
Other income (expense), net |
18 |
|
|
1 |
|
|
1,700.0 |
% |
||
|
Total other income (expense) |
(1,305) |
|
|
(1,265) |
|
|
(3.2) |
% |
||
|
Income (loss) before taxes |
2,010 |
|
|
2,096 |
|
|
(4.1) |
% |
||
|
Add: impairment charges |
— |
|
|
— |
|
|
NM |
|||
|
Segment income (loss) |
$ |
2,010 |
|
|
$ |
2,096 |
|
|
(4.1) |
% |
|
|
|
|
|
|
|
|||||
|
Unit Sales Volume: |
|
|
|
|
|
|||||
|
Used vehicles |
19,670 |
|
|
13,986 |
|
|
40.6 |
% |
||
|
Wholesale vehicles |
2,861 |
|
|
1,765 |
|
|
62.1 |
% |
||
|
|
|
|
|
|
|
|||||
|
Gross Profit Per Unit: |
|
|
|
|
|
|||||
|
Total used vehicle and F&I |
$ |
2,339 |
|
|
$ |
2,294 |
|
|
2.0 |
% |
|
NM = Not Meaningful |
||||||||||
EchoPark Segment - Same Market
|
|
Three Months Ended March 31, |
|
Better / (Worse) |
|||||||
|
|
2021 |
|
2020 |
|
% Change |
|||||
|
|
(In thousands, except unit and per unit data) |
|||||||||
|
Revenues: |
|
|
|
|
|
|||||
|
Used vehicles |
$ |
333,577 |
|
|
$ |
283,164 |
|
|
17.8 |
% |
|
Wholesale vehicles |
15,555 |
|
|
6,103 |
|
|
154.9 |
% |
||
|
Total vehicles |
349,132 |
|
|
289,267 |
|
|
20.7 |
% |
||
|
Parts, service and collision repair |
10,103 |
|
|
10,145 |
|
|
(0.4) |
% |
||
|
Finance, insurance and other, net |
36,823 |
|
|
32,263 |
|
|
14.1 |
% |
||
|
Total revenues |
$ |
396,058 |
|
|
$ |
331,675 |
|
|
19.4 |
% |
|
Gross Profit: |
|
|
|
|
|
|||||
|
Used vehicles |
$ |
(1,485) |
|
|
$ |
(184) |
|
|
(707.1) |
% |
|
Wholesale vehicles |
122 |
|
|
(74) |
|
|
264.9 |
% |
||
|
Total vehicles |
(1,363) |
|
|
(258) |
|
|
(428.3) |
% |
||
|
Parts, service and collision repair |
7 |
|
|
(197) |
|
|
103.6 |
% |
||
|
Finance, insurance and other, net |
36,823 |
|
|
32,263 |
|
|
14.1 |
% |
||
|
Total gross profit |
$ |
35,467 |
|
|
$ |
31,808 |
|
|
11.5 |
% |
|
|
|
|
|
|
|
|||||
|
Unit Sales Volume: |
|
|
|
|
|
|||||
|
Used vehicles |
15,128 |
|
|
13,986 |
|
|
8.2 |
% |
||
|
Wholesale vehicles |
2,230 |
|
|
1,765 |
|
|
26.3 |
% |
||
|
|
|
|
|
|
|
|||||
|
Gross Profit Per Unit: |
|
|
|
|
|
|||||
|
Total used vehicle and F&I |
$ |
2,336 |
|
|
$ |
2,294 |
|
|
1.8 |
% |
|
Note: All currently operating EchoPark stores in a local geographic market are included within the same market group as of the first full month following the first anniversary of the market's opening. |
||||||||||
Selling, General and Administrative ("SG&A") Expenses - Consolidated
|
|
Three Months Ended March 31, |
|
Better / (Worse) |
|||||||||||
|
|
2021 |
|
2020 |
|
Change |
|
% Change |
|||||||
|
|
(In thousands) |
|||||||||||||
|
Reported: |
|
|
|
|
|
|
|
|||||||
|
Compensation |
$ |
188,492 |
|
|
$ |
174,422 |
|
|
$ |
(14,070) |
|
|
(8.1) |
% |
|
Advertising |
12,169 |
|
|
14,135 |
|
|
1,966 |
|
|
13.9 |
% |
|||
|
Rent |
13,744 |
|
|
13,865 |
|
|
121 |
|
|
0.9 |
% |
|||
|
Other |
74,951 |
|
|
79,734 |
|
|
4,783 |
|
|
6.0 |
% |
|||
|
Total SG&A expenses |
$ |
289,356 |
|
|
$ |
282,156 |
|
|
$ |
(7,200) |
|
|
(2.6) |
% |
|
Adjusted: |
|
|
|
|
|
|
|
|||||||
|
Total adjusted SG&A expenses |
$ |
289,356 |
|
|
$ |
282,156 |
|
|
$ |
(7,200) |
|
|
(2.6) |
% |
|
|
|
|
|
|
|
|
|
|||||||
|
Reported: |
|
|
|
|
|
|
|
|||||||
|
SG&A expenses as a % of gross profit: |
|
|
|
|
|
|
|
|||||||
|
Compensation |
47.0 |
% |
|
49.8 |
% |
|
280 |
|
bps |
|||||
|
Advertising |
3.0 |
% |
|
4.0 |
% |
|
100 |
|
bps |
|||||
|
Rent |
3.4 |
% |
|
4.0 |
% |
|
60 |
|
bps |
|||||
|
Other |
18.8 |
% |
|
22.7 |
% |
|
390 |
|
bps |
|||||
|
Total SG&A expenses as a % of gross profit |
72.2 |
% |
|
80.5 |
% |
|
830 |
|
bps |
|||||
|
Adjusted: |
|
|
|
|
|
|
||||||||
|
Total adjusted SG&A expenses as a % of gross profit |
72.2 |
% |
|
80.5 |
% |
|
830 |
|
bps |
|||||
Earnings Per Share from Continuing Operations - Non-GAAP Reconciliation
|
|
Three Months Ended March 31, 2021 |
|
Three Months Ended March 31, 2020 |
||||||||||||||||||
|
|
Weighted- Average Shares |
|
Amount |
|
Per Share Amount |
|
Weighted- Average Shares |
|
Amount |
|
Per Share Amount |
||||||||||
|
|
(In thousands, except per share amounts) |
||||||||||||||||||||
|
Diluted earnings (loss) and shares from continuing operations (1) |
43,542 |
|
|
$ |
53,689 |
|
|
$ |
1.23 |
|
|
42,615 |
|
|
$ |
(199,131) |
|
|
$ |
(4.67) |
|
|
Pre-tax items of interest: |
|
|
|
|
|
|
|
|
|
|
|
||||||||||
|
Impairment charges |
|
|
$ |
— |
|
|
|
|
|
|
$ |
268,000 |
|
|
|
||||||
|
Total pre-tax items of interest |
|
|
$ |
— |
|
|
|
|
|
|
$ |
268,000 |
|
|
|
||||||
|
Tax effect of above items |
|
|
$ |
— |
|
|
|
|
|
|
$ |
(51,295) |
|
|
|
||||||
|
Adjusted diluted earnings (loss) and shares from continuing operations |
43,542 |
|
|
$ |
53,689 |
|
|
$ |
1.23 |
|
|
43,432 |
|
|
$ |
17,574 |
|
|
$ |
0.40 |
|
|
(1) Basic Weighted-Average Shares Used For Three Months Ended March 31, 2020 Due To Net Loss On GAAP Basis |
|||||||||||||||||||||
Adjusted EBITDA - Non-GAAP Reconciliation
|
|
Three Months Ended March 31, 2021 |
|
Three Months Ended March 31, 2020 |
||||||||||||||||||||||||||||
|
|
Franchised Dealerships Segment |
|
EchoPark Segment |
|
Discontinued Operations |
|
Total |
|
Franchised Dealerships Segment |
|
EchoPark Segment |
|
Discontinued Operations |
|
Total |
||||||||||||||||
|
|
(In thousands) |
||||||||||||||||||||||||||||||
|
Net income (loss) |
|
|
|
|
|
|
$ |
54,222 |
|
|
|
|
|
|
|
|
$ |
(199,333) |
|
||||||||||||
|
Provision for income taxes |
|
|
|
|
|
|
19,051 |
|
|
|
|
|
|
|
|
(44,200) |
|
||||||||||||||
|
Income (loss) before taxes |
$ |
70,543 |
|
|
$ |
2,010 |
|
|
$ |
720 |
|
|
$ |
73,273 |
|
|
$ |
(245,344) |
|
|
$ |
2,096 |
|
|
$ |
(285) |
|
|
$ |
(243,533) |
|
|
Non-floor plan interest |
9,127 |
|
|
334 |
|
|
— |
|
|
9,461 |
|
|
10,043 |
|
|
365 |
|
|
— |
|
|
10,408 |
|
||||||||
|
Depreciation and amortization |
21,206 |
|
|
3,304 |
|
|
— |
|
|
24,510 |
|
|
20,144 |
|
|
2,708 |
|
|
— |
|
|
22,852 |
|
||||||||
|
Stock-based compensation expense |
3,485 |
|
|
— |
|
|
— |
|
|
3,485 |
|
|
2,427 |
|
|
— |
|
|
— |
|
|
2,427 |
|
||||||||
|
Asset impairment charges |
— |
|
|
— |
|
|
— |
|
|
— |
|
|
268,000 |
|
|
— |
|
|
— |
|
|
268,000 |
|
||||||||
|
Long-term compensation charges |
— |
|
|
500 |
|
|
— |
|
|
500 |
|
|
— |
|
|
— |
|
|
— |
|
|
— |
|
||||||||
|
Loss (gain) on franchise and real estate disposals |
(21) |
|
|
14 |
|
|
— |
|
|
(7) |
|
|
— |
|
|
— |
|
|
— |
|
|
— |
|
||||||||
|
Adjusted EBITDA |
$ |
104,340 |
|
|
$ |
6,162 |
|
|
$ |
720 |
|
|
$ |
111,222 |
|
|
$ |
55,270 |
|
|
$ |
5,169 |
|
|
$ |
(285) |
|
|
$ |
60,154 |
|
|
|
|
|
|
|
|
|
|
|
|
|
|
|
|
|
|||||||||||||||||