

IIHS: Small Cars Kill - Are Higher MPG And A Smaller Monthly Payment Worth Your Family's Lives?
 Size Matters When You Are Not Having Fun |
SEE ALSO: IIHS Death Status Report (PDF)
SEE ALSO: IIHS Vehicle Crash Ratings
SEE ALSO: Americans Want Big Cars and Pickups...Detroit Wants to Build Big...So Let's Have Big...BUT! (Originally Published April 2009)
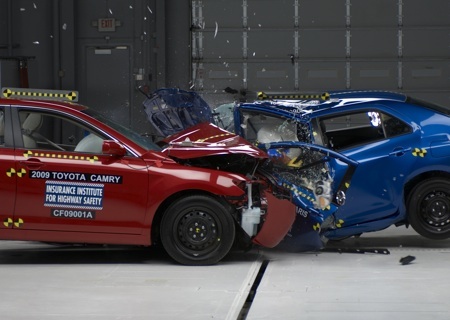
Arlington, Va., May 28, 2020; Despite manufacturers’ efforts to make them safer, the smallest late-model cars remain the most dangerous, according to the most recent driver death rates calculated by the Insurance Institute of Highway Safety.
 Click To Enlarge |
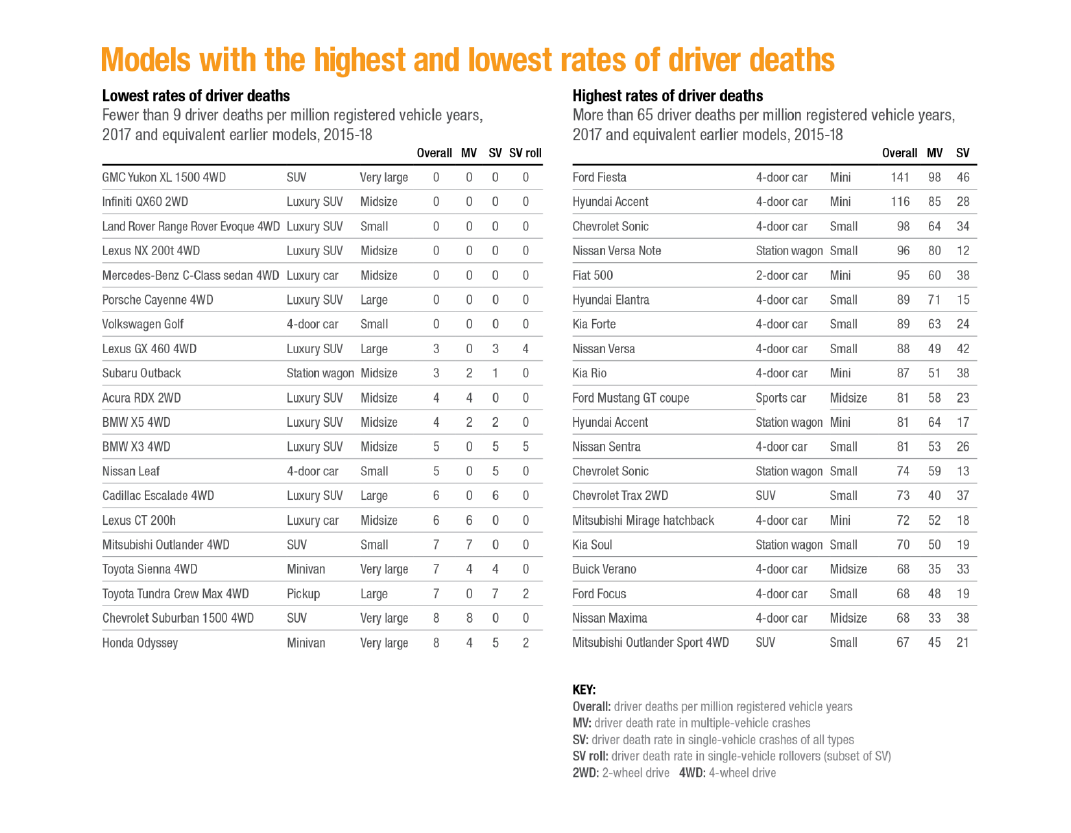
Small cars and minicars accounted for 15 of the 20 models with the highest death rates for model year 2017, while nearly half of the 20 models with the lowest death rates were luxury SUVs.
“Smaller vehicles offer less protection for the driver in crashes, and their lighter mass means that they take the brunt of collisions with larger vehicles,” says Joe Nolan, IIHS senior vice president of vehicle research.
Very large SUVs have the lowest overall death rate of any vehicle category with 15 fatalities per million registered vehicle years. Minicars have the highest at 82.
The average driver death rate for all 2017 models increased to 36 deaths, compared with 30 for 2014 models. That’s a further increase from a low of 28 for 2011 models following a steady decline since the 1970s. The rise is consistent with a larger number of U.S. traffic fatalities over the four-year period covered by this study, compared with the previous one. From 2015 to 2018 there were 147,324 fatalities, compared with 134,905 from 2012 to 2015.
The death rates for 2017 models vary widely from 0 for seven models to 141 for the worst performer, the 2017 Ford Fiesta, a 4-door minicar that earned a rating of “marginal” in the IIHS driver-side small overlap crash test. Including the Fiesta, half the 2017 models with the highest death rates were also among the worst for model year 2014, the last time IIHS looked at the data.
IIHS has been calculating driver death rates approximately every three years since 1989. The rates include only driver deaths because all vehicles on the road have drivers, but not all of them have passengers or the same number of passengers. The number of deaths is derived from the federal Fatality Analysis Reporting System. Registration data come from IHS Markit.
Alongside vehicle safety ratings, driver death rates are another source of information consumers can use to inform their purchasing decisions.
The two types of information complement each other. IIHS ratings are designed to compare vehicles in the same size category. Frontal crash test results can’t be compared across sizes because the kinetic energy involved in the test increases with vehicle weight.
In contrast, the driver death rates can be compared across vehicle classes. However, as a comparative tool, they have their own limitations. While the death rates are adjusted for driver age and gender, they don’t capture other factors that might influence fatality rates, such as the speeds people drive, the number of miles they travel per day and the types of roads they use.
To look at the effect of one of those factors, this year IIHS also compared the driver death rates per 10 billion miles traveled. Through a cooperative agreement in place since 2015, the IIHS-affiliated Highway Loss Data Institute was able to match Vehicle Identification Numbers from its database to odometer readings from CARFAX, an IHS Markit unit that maintains a vehicle history database. Odometer readings came from multiple sources, including title transfers, yearly inspections, and routine maintenance service.
For the most part, the mileage data bolstered the original findings about vehicle size and explained some notable exceptions.
Sports cars and luxury cars, which traveled fewer miles per year than other models, showed relatively higher driver death rates by the alternative method. Death rates for pickups trended lower by miles driven.
Within each vehicle category, the order of individual vehicles did not change much. For this reason, IIHS has decided to stick with the usual registration-year method for the published make and model results.
By that method, nine of the 20 models with the lowest death rates are luxury SUVs, two more are midsize luxury cars, and four others are minivans or very large SUVs. The overall death rates for luxury vehicles are also substantially lower than the averages for nonluxury vehicles of the same sizes.
Luxury vehicles often come equipped with advanced safety features that aren’t widely installed on less expensive ones, such as blind spot warning and lane departure prevention.
Notably, two small cars defy the average for their size and class, whether driver death rates are measured against registered vehicle years or miles traveled. The Volkswagen Golf and the Nissan Leaf have death rates of 0 and 5 per million registered vehicle years, respectively. Their rates per 10 billion miles were the same. For comparison, the overall rate for small cars was 61 deaths per million vehicle years and 45 per 10 billion miles.
The Golf’s results are particularly remarkable, considering that the 2014 version was among the worst performers, with a death rate of 63 per million vehicle years, prior to a redesign for the 2015 model year.
Although the number of miles driven was not a factor, the results for the Leaf, an all-electric car, may reflect when and where electric vehicles are driven.
The latest rates are based on fatalities that occurred from 2015 to 2018 for vehicles from the 2017 model year, as well as earlier models with the same designs and features. The numbers represent the estimated risks for 2017 models, but the data include models from as far back as 2014 if the vehicles have not been substantially redesigned over the intervening period. Including these older, equivalent vehicles makes the sample size larger and therefore increases the reliability of the results. To be included, a vehicle must have had at least 100,000 registered vehicle years of exposure from 2015 to 2018 or at least 20 deaths.
<Highest rates of driver deaths
| Overall driver deaths per million registered vehicle years | Multiple-vehicle crashes | Single-vehicle crashes | Single-vehicle rollovers | |||
|---|---|---|---|---|---|---|
| Ford Fiesta | 4-door car | Mini | 141 | 98 | 46 | 13 |
| Hyundai Accent | 4-door car | Mini | 116 | 85 | 28 | 9 |
| Chevrolet Sonic | 4-door car | Small | 98 | 64 | 34 | 10 |
| Nissan Versa Note | Station wagon | Small | 96 | 80 | 12 | 7 |
| Fiat 500 | 2-door car | Mini | 95 | 60 | 38 | 37 |
| Hyundai Elantra | 4-door car | Small | 89 | 71 | 15 | 9 |
| Kia Forte | 4-door car | Small | 89 | 63 | 24 | 2 |
| Nissan Versa | 4-door car | Small | 88 | 49 | 42 | 14 |
| Kia Rio | 4-door car | Mini | 87 | 51 | 38 | 0 |
| Ford Mustang GT coupe | Sports car | Midsize | 81 | 58 | 23 | 12 |
| Hyundai Accent | Station wagon | Mini | 81 | 64 | 17 | 9 |
| Nissan Sentra | 4-door car | Small | 81 | 53 | 26 | 11 |
| Chevrolet Sonic | Station wagon | Small | 74 | 59 | 13 | 13 |
| Chevrolet Trax 2WD | SUV | Small | 73 | 40 | 37 | 20 |
| Mitsubishi Mirage hatchback | 4-door car | Mini | 72 | 52 | 18 | 5 |
| Kia Soul | Station wagon | Small | 70 | 50 | 19 | 10 |
| Buick Verano | 4-door car | Midsize | 68 | 35 | 33 | 14 |
| Ford Focus | 4-door car | Small | 68 | 48 | 19 | 9 |
| Nissan Maxima | 4-door car | Midsize | 68 | 33 | 38 | 4 |
| Mitsubishi Outlander Sport 4WD | SUV | Small | 67 | 45 | 21 | 5 |
Lowest rates of driver deaths
| Overall driver deaths per million registered vehicle years | Multiple-vehicle crashes | Single-vehicle crashes | Single-vehicle rollovers | |||
|---|---|---|---|---|---|---|
| GMC Yukon XL 1500 4WD | SUV | Very large | 0 | 0 | 0 | 0 |
| Infiniti QX60 2WD | Luxury SUV | Midsize | 0 | 0 | 0 | 0 |
| Land Rover Range Rover Evoque 4WD | Luxury SUV | Small | 0 | 0 | 0 | 0 |
| Lexus NX 200t 4WD | Luxury SUV | Midsize | 0 | 0 | 0 | 0 |
| Mercedes-Benz C-Class sedan 4WD | Luxury car | Midsize | 0 | 0 | 0 | 0 |
| Porsche Cayenne 4WD | Luxury SUV | Large | 0 | 0 | 0 | 0 |
| Volkswagen Golf | 4-door car | Small | 0 | 0 | 0 | 0 |
| Lexus GX 460 4WD | Luxury SUV | Large | 3 | 0 | 3 | 4 |
| Subaru Outback | Station wagon | Midsize | 3 | 2 | 1 | 0 |
| Acura RDX 2WD | Luxury SUV | Midsize | 4 | 4 | 0 | 0 |
| BMW X5 4WD | Luxury SUV | Midsize | 4 | 2 | 2 | 0 |
| BMW X3 4WD | Luxury SUV | Midsize | 5 | 0 | 5 | 5 |
| Nissan Leaf | 4-door car | Small | 5 | 0 | 5 | 0 |
| Cadillac Escalade 4WD | Luxury SUV | Large | 6 | 0 | 6 | 0 |
| Lexus CT 200h | Luxury car | Midsize | 6 | 6 | 0 | 0 |
| Mitsubishi Outlander 4WD | SUV | Small | 7 | 7 | 0 | 0 |
| Toyota Sienna 4WD | Minivan | Very large | 7 | 4 | 4 | 0 |
| Toyota Tundra Crew Max 4WD | Pickup | Large | 7 | 0 | 7 | 2 |
| Chevrolet Suburban 1500 4WD | SUV | Very large | 8 | 8 | 0 | 0 |
| Honda Odyssey | Minivan | Very large | 8 | 4 | 5 | 2 |
Driver death rates by vehicle style and size
Registered vehicle years vs. mileage
2017 and equivalent earlier models, 2015-18
| Deaths per million registration years | Deaths per 10 billion miles | Average annual mileage | |
|---|---|---|---|
| Overall | 36 | 26 | 13,794 |
| Cars | 48 | 36 | 13,471 |
| 4-door | |||
| Mini | 108 | 78 | 13,897 |
| Small | 62 | 45 | 13,772 |
| Midsize | 43 | 30 | 14,468 |
| Large | 52 | 36 | 14,618 |
| 2-door | |||
| Mini | 41 | 44 | 9,272 |
| Small | 45 | 39 | 11,410 |
| Midsize | 44 | 36 | 12,207 |
| Large | 67 | 58 | 11,656 |
| Sports | |||
| Midsize | 51 | 63 | 8,045 |
| Large | 48 | 50 | 9,529 |
| Luxury | |||
| Midsize | 22 | 20 | 10,961 |
| Large | 19 | 19 | 10,244 |
| Very large | 20 | 19 | 10,478 |
| Station wagons | |||
| Mini | 65 | 53 | 12,419 |
| Small | 54 | 40 | 13,519 |
| Midsize | 4 | 3 | 13,428 |
| Minivans | 22 | 15 | 14,939 |
| SUVs | 25 | 19 | 13,589 |
| 4-wheel drive | |||
| Small | 24 | 19 | 12,684 |
| Midsize | 21 | 15 | 13,573 |
| Large | 22 | 15 | 15,130 |
| Very large | 7 | 4 | 17,969 |
| 2-wheel drive | |||
| Small | 42 | 31 | 13,774 |
| Midsize | 34 | 24 | 14,429 |
| Large | 26 | 17 | 15,510 |
| Very large | 30 | 17 | 18,465 |
| 4-wheel drive luxury | |||
| Small | 25 | 23 | 10,629 |
| Midsize | 9 | 7 | 11,827 |
| Large | 5 | 4 | 12,476 |
| Very large | 19 | 13 | 15,432 |
| 2-wheel drive luxury | |||
| Small | 44 | 40 | 11,121 |
| Midsize | 11 | 9 | 12,056 |
| Large | 26 | 18 | 14,841 |
| Pickups | 29 | 18 | 16,155 |
| 4-wheel drive | |||
| Small | 24 | 18 | 13,429 |
| Large | 26 | 17 | 15,526 |
| Very large | 27 | 15 | 18,817 |
| 2-wheel drive | |||
| Small | 31 | 21 | 14,644 |
| Large | 38 | 23 | 16,551 |
| Very large | 28 | 13 | 22,167 |
The Insurance Institute for Highway Safety (IIHS) is an independent, nonprofit scientific and educational organization dedicated to reducing the losses — deaths, injuries and property damage — from motor vehicle crashes. The Highway Loss Data Institute (HLDI) shares and supports this mission through scientific studies of insurance data representing the human and economic losses resulting from the ownership and operation of different types of vehicles and by publishing insurance loss results by vehicle make and model.
Both organizations are wholly supported by auto insurers.