

Toyota Reports August Sales of 224,381 Units
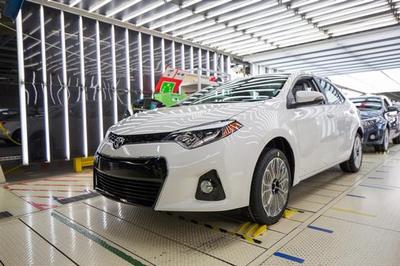 Toyota Corolla |
Highlander and Tacoma Post Best August Sales Since 2003
Lexus posts Best-Ever August Sales
TORRANCE, CA -- Sept. 1, 2015: Toyota Motor Sales
(TMS), U.S.A., Inc., today reported August 2015 sales of 224,381 units, a
decrease of 8.8 percent from August 2014 on a volume basis. With one
less selling day in August 2015 than in August 2014, sales were down 5.3
percent on a daily selling rate (DSR) basis.
Toyota
Division posted August 2015 sales of 190,894 units, down 10.5 percent on a
volume and 7.1 percent on a DSR basis.
"Consumer
confidence is at its highest level since January, despite predicted slower
August industry sales,” said Bill Fay, Toyota Division group vice
president and general manager. “For the Toyota Division, Tacoma and
Highlander had their best sales month since 2003. In September, we are
excited for the launch of the all-new Scion iM, iA and the 2016
Tacoma.”
Lexus reported August sales of 33,487 units,
up 2.1 percent from August 2014 on a volume basis and 6.0 percent on a DSR
basis.
"The luxury market continued its hot streak
last month," said Jeff Bracken, Lexus group vice president and general
manager. "In August, Lexus had a best-ever sales month, led by the all-new
NX and RC."
August 2015 Highlights:
- Corolla posted sales of 31,726 units
- Camry August sales were 37,592 units
- Total TMS light trucks posted sales of 93,575 units
- Highlander up more than 16 percent
- 4Runner up over 15 percent
- RAV4 posted sales of 30,534 units
- Sequoia posted sales of 1,048 units
- Combined Tacoma and Tundra pickup sales up 0.4 percent
- Lexus luxury utility vehicles up 15.2 percent
- All-new NX posted sales of 4,448 units
- All-new RC posted sales of 1,337 units
- GX posted sales of 2,221 units
*Note: Unless otherwise stated, all figures reflect unadjusted raw sales volume
| TOYOTA U.S. SALES SUMMARY | |||||||||||||||||||||||
| August, 2015 | |||||||||||||||||||||||
| -- CURRENT MONTH -- | -- CALENDAR YEAR TO DATE -- | ||||||||||||||||||||||
| DSR % | VOL % | DSR % | VOL % | ||||||||||||||||||||
| 2015 | 2014 | CHG | CHG | 2015 | 2014 | CHG | CHG | ||||||||||||||||
| TOTAL TOYOTA | 224,381 | 246,100 | -5.3 | -8.8 | 1,673,002 | 1,627,509 | 3.3 | 2.8 | |||||||||||||||
| TOTAL TOYOTA DIV. | 190,894 | 213,291 | -7.1 | -10.5 | 1,450,851 | 1,428,678 | 2.0 | 1.6 | |||||||||||||||
| TOTAL LEXUS | 33,487 | 32,809 | 6.0 | 2.1 | 222,151 | 198,831 | 12.3 | 11.7 | |||||||||||||||
| YARIS | 858 | 523 | 70.4 | 64.1 | 14,949 | 9,741 | 54.2 | 53.5 | |||||||||||||||
| COROLLA | 31,726 | 33,088 | -0.4 | -4.1 | 252,106 | 238,275 | 6.3 | 5.8 | |||||||||||||||
| PRIUS | 17,757 | 23,437 | -21.3 | -24.2 | 125,830 | 151,213 | -16.4 | -16.8 | |||||||||||||||
| CAMRY | 37,592 | 44,043 | -11.4 | -14.6 | 291,843 | 306,471 | -4.3 | -4.8 | |||||||||||||||
| AVALON | 5,491 | 7,040 | -19.0 | -22.0 | 39,490 | 45,163 | -12.1 | -12.6 | |||||||||||||||
| SCION FR-S | 960 | 1,429 | -30.2 | -32.8 | 7,766 | 10,262 | -24.0 | -24.3 | |||||||||||||||
| SCION iQ | 9 | 219 | -95.7 | -95.9 | 458 | 1,620 | -71.6 | -71.7 | |||||||||||||||
| SCION xD | 16 | 789 | -97.9 | -98.0 | 766 | 5,757 | -86.6 | -86.7 | |||||||||||||||
| SCION xB | 1,376 | 1,621 | -11.8 | -15.1 | 11,384 | 11,254 | 1.7 | 1.2 | |||||||||||||||
| SCION tC | 1,534 | 2,128 | -25.1 | -27.9 | 12,317 | 13,056 | -5.2 | -5.7 | |||||||||||||||
| TOTAL SCION | 3,895 | 6,186 | -34.6 | -37.0 | 32,691 | 41,949 | -21.7 | -22.1 | |||||||||||||||
| TOTAL TOYOTA DIV. CAR | 97,319 | 114,317 | -11.6 | -14.9 | 756,909 | 792,812 | -4.1 | -4.5 | |||||||||||||||
| CT | 1,504 | 2,191 | -28.7 | -31.4 | 10,001 | 12,507 | -19.6 | -20.0 | |||||||||||||||
| IS | 4,537 | 5,312 | -11.3 | -14.6 | 32,237 | 33,427 | -3.1 | -3.6 | |||||||||||||||
| RC | 1,337 | 0 | N/A | N/A | 9,299 | 0 | N/A | N/A | |||||||||||||||
| ES | 7,286 | 7,692 | -1.6 | -5.3 | 41,767 | 47,188 | -11.1 | -11.5 | |||||||||||||||
| GS | 1,795 | 2,537 | -26.5 | -29.2 | 14,638 | 14,660 | 0.3 | -0.2 | |||||||||||||||
| LS | 532 | 758 | -27.1 | -29.8 | 4,864 | 5,336 | -8.4 | -8.8 | |||||||||||||||
| LFA | 1 | 3 | -65.4 | -66.7 | 7 | 15 | -53.1 | -53.3 | |||||||||||||||
| TOTAL LEXUS CAR | 16,992 | 18,493 | -4.6 | -8.1 | 112,813 | 113,133 | 0.2 | -0.3 | |||||||||||||||
| TOTAL TOYOTA CAR | 114,311 | 132,810 | -10.6 | -13.9 | 869,722 | 905,945 | -3.5 | -4.0 | |||||||||||||||
| RAV4 | 30,534 | 35,614 | -11.0 | -14.3 | 200,818 | 179,345 | 12.5 | 12.0 | |||||||||||||||
| FJ CRUISER | 2 | 1,692 | -99.9 | -99.9 | 223 | 11,353 | -98.0 | -98.0 | |||||||||||||||
| VENZA | 2,147 | 2,793 | -20.2 | -23.1 | 17,573 | 21,587 | -18.2 | -18.6 | |||||||||||||||
| HIGHLANDER | 13,333 | 11,489 | 20.5 | 16.1 | 104,448 | 94,984 | 10.5 | 10.0 | |||||||||||||||
| 4RUNNER | 8,811 | 7,657 | 19.5 | 15.1 | 63,396 | 49,612 | 28.4 | 27.8 | |||||||||||||||
| SIENNA | 11,249 | 12,386 | -5.7 | -9.2 | 94,046 | 86,338 | 9.5 | 8.9 | |||||||||||||||
| SEQUOIA | 1,048 | 913 | 19.2 | 14.8 | 8,155 | 7,814 | 4.9 | 4.4 | |||||||||||||||
| LAND CRUISER | 164 | 258 | -34.0 | -36.4 | 1,637 | 1,964 | -16.2 | -16.6 | |||||||||||||||
| TOTAL TOYOTA DIV. SUV | 56,039 | 60,416 | -3.7 | -7.2 | 396,250 | 366,659 | 8.6 | 8.1 | |||||||||||||||
| TACOMA | 16,230 | 14,338 | 17.5 | 13.2 | 122,064 | 102,736 | 19.4 | 18.8 | |||||||||||||||
| TUNDRA | 10,057 | 11,834 | -11.7 | -15.0 | 81,582 | 80,133 | 2.3 | 1.8 | |||||||||||||||
| TOTAL TOYOTA DIV. PICKUP | 26,287 | 26,172 | 4.3 | 0.4 | 203,646 | 182,869 | 11.9 | 11.4 | |||||||||||||||
| TOTAL TOYOTA DIV. TRUCK | 93,575 | 98,974 | -1.8 | -5.5 | 693,942 | 635,866 | 9.7 | 9.1 | |||||||||||||||
| NX | 4,448 | 0 | N/A | N/A | 28,834 | 0 | N/A | N/A | |||||||||||||||
| RX | 9,620 | 11,841 | -15.6 | -18.8 | 62,163 | 68,763 | -9.2 | -9.6 | |||||||||||||||
| GX | 2,221 | 2,198 | 4.9 | 1.0 | 16,249 | 14,429 | 13.2 | 12.6 | |||||||||||||||
| LX | 206 | 277 | -22.8 | -25.6 | 2,092 | 2,506 | -16.1 | -16.5 | |||||||||||||||
| TOTAL LEXUS TRUCK | 16,495 | 14,316 | 19.7 | 15.2 | 109,338 | 85,698 | 28.2 | 27.6 | |||||||||||||||
| TOTAL TOYOTA TRUCK | 110,070 | 113,290 | 0.9 | -2.8 | 803,280 | 721,564 | 11.9 | 11.3 | |||||||||||||||
| SELLING DAYS | 26 | 27 | 204 | 205 | |||||||||||||||||||
| DSR = DAILY SELLING RATE | |||||||||||||||||||||||
| TOYOTA U.S. SALES SUMMARY | |||||||||||||||||||||||
| August, 2015 | |||||||||||||||||||||||
| -- CURRENT MONTH -- | -- CALENDAR YEAR TO DATE -- | ||||||||||||||||||||||
| DSR % | VOL % | DSR % | VOL % | ||||||||||||||||||||
| 2015 | 2014 | CHG | CHG | 2015 | 2014 | CHG | CHG | ||||||||||||||||
| * NORTH AMERICAN BUILT VEHICLES | |||||||||||||||||||||||
| COROLLA | 31,726 | 33,088 | -0.4 | -4.1 | 252,106 | 238,210 | 6.4 | 5.8 | |||||||||||||||
| CAMRY | 37,576 | 44,031 | -11.4 | -14.7 | 291,709 | 306,354 | -4.3 | -4.8 | |||||||||||||||
| AVALON | 5,491 | 7,040 | -19.0 | -22.0 | 39,490 | 45,163 | -12.1 | -12.6 | |||||||||||||||
| RAV4 | 14,464 | 21,161 | -29.0 | -31.6 | 128,833 | 119,731 | 8.1 | 7.6 | |||||||||||||||
| VENZA | 2,147 | 2,793 | -20.2 | -23.1 | 17,573 | 21,587 | -18.2 | -18.6 | |||||||||||||||
| HIGHLANDER | 12,956 | 11,152 | 20.6 | 16.2 | 102,009 | 92,526 | 10.8 | 10.2 | |||||||||||||||
| SIENNA | 11,249 | 12,386 | -5.7 | -9.2 | 94,046 | 86,338 | 9.5 | 8.9 | |||||||||||||||
| SEQUOIA | 1,048 | 913 | 19.2 | 14.8 | 8,155 | 7,814 | 4.9 | 4.4 | |||||||||||||||
| TACOMA | 16,230 | 14,338 | 17.5 | 13.2 | 122,064 | 102,736 | 19.4 | 18.8 | |||||||||||||||
| TUNDRA | 10,057 | 11,834 | -11.7 | -15.0 | 81,582 | 80,133 | 2.3 | 1.8 | |||||||||||||||
| RX | 9,037 | 9,308 | 0.8 | -2.9 | 59,017 | 54,700 | 8.4 | 7.9 | |||||||||||||||
| TOTAL | 151,981 | 168,044 | -6.1 | -9.6 | 1,196,584 | 1,155,292 | 4.1 | 3.6 | |||||||||||||||
| N.A. VEHICLES % OF TOTAL | 67.7% | 68.3% | 71.5% | 71.0% | |||||||||||||||||||
| TOYOTA DIV. IMPORT CAR | 22,526 | 30,158 | -22.4 | -25.3 | 173,604 | 203,085 | -14.1 | -14.5 | |||||||||||||||
| LEXUS IMPORT CAR | 16,992 | 18,493 | -4.6 | -8.1 | 112,813 | 113,133 | 0.2 | -0.3 | |||||||||||||||
| TOYOTA DIV NA BUILT CARS | 74,793 | 84,159 | -7.7 | -11.1 | 583,305 | 589,727 | -0.6 | -1.1 | |||||||||||||||
| TOTAL TOYOTA CARS | 114,311 | 132,810 | -10.6 | -13.9 | 869,722 | 905,945 | -3.5 | -4.0 | |||||||||||||||
| TOYOTA DIV. IMPORT TRUCK | 25,424 | 24,397 | 8.2 | 4.2 | 139,680 | 125,001 | 12.3 | 11.7 | |||||||||||||||
| LEXUS IMPORT TRUCK | 7,458 | 5,008 | 54.6 | 48.9 | 50,321 | 30,998 | 63.1 | 62.3 | |||||||||||||||
| TOYOTA DIV NA BUILT TRUCK | 68,151 | 74,577 | -5.1 | -8.6 | 554,262 | 510,865 | 9.0 | 8.5 | |||||||||||||||
| LEXUS NA BUILT TRUCK | 9,037 | 9,308 | 0.8 | -2.9 | 59,017 | 54,700 | 8.4 | 7.9 | |||||||||||||||
| TOTAL TOYOTA TRUCK | 110,070 | 113,290 | 0.9 | -2.8 | 803,280 | 721,564 | 11.9 | 11.3 | |||||||||||||||
| SELLING DAYS | 26 | 27 | 204 | 205 | |||||||||||||||||||
| DSR = DAILY SELLING RATE | |||||||||||||||||||||||
| --CURRENT MONTH-- | --CALENDAR YEAR TO DATE-- | ||||||||||||||||||||||
| Memo: | 2015 | 2014 | DSR % | 2015 | 2014 | DSR % | |||||||||||||||||
| Toyota Prius Sedan | 10,450 | 14,724 | -26.30% | 75,826 | 90,627 | -15.90% | |||||||||||||||||
| Toyota Prius V (only) | 3,119 | 3,506 | -7.60% | 19,904 | 20,725 | 3.50% | |||||||||||||||||
| Toyota Prius C (only) | 3,844 | 4,389 | -9.00% | 26,282 | 28,372 | 6.90% | |||||||||||||||||
| Toyota Prius Phv (only) | 344 | 818 | -56.30% | 3,818 | 11,489 | 66.60% | |||||||||||||||||