

Compact SUVs Expected to Conquest March Auto Sales
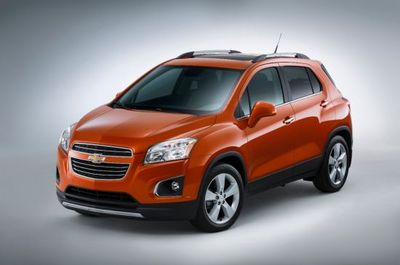 2015 Chevrolet Trax--One of the New Compact SUVs |
SANTA MONICA, CA -- March 26, 2015: Edmunds.com, forecasts that 1,522,881 new cars and trucks will be sold in the U.S. in March for an estimated Seasonally Adjusted Annual Rate (SAAR) of 16.9 million. The projected sales will be a 21.3 percent increase from February 2015, and a 0.8 percent decrease from March 2014.
"In March, car shoppers were quite drawn to compact SUVs, continuing a recent trend," says Edmunds.com Senior Analyst Jessica Caldwell, whose team focused on this in a new Key Insights report entitled "Conquesting the Market" which can be found at Edmunds Industry Center "Compact SUVs have earned record market share in 2015 but the popularity of these vehicles has not generated incremental sales. This trend is having an adverse affect on midsize and compact car sales. Those segments' market shares are at an eight year low so far this year."
| SALES VOLUME FORECAST, BY MANUFACTURER | |||||
|
Sales Volume | March 2015 Forecast | March 2014 | February 2015 | Change from March 2014 | Change from February 2015 |
| GM | 252,563 | 256,047 | 231,379 | -1.4% | 9.2% |
| Ford | 230,339 | 243,417 | 179,671 | -5.4% | 28.2% |
| Toyota | 224,303 | 215,348 | 180,467 | 4.2% | 24.3% |
| Chrysler Group | 200,059 | 194,915 | 163,587 | 2.6% |
22.3% |
| Nissan | 141,057 | 149,136 | 118,436 | -5.4% | 19.1% |
| Honda | 128,829 | 133,318 | 105,466 | -3.4% | 22.2% |
| Hyundai/Kia | 116,887 | 121,782 | 96,535 | -4.0% | 21.1% |
| VW/Audi | 47,446 | 50,963 | 37,165 | -6.9% | 27.7% |
| Industry |
1,522,881 | 1,535,131 | 1,255,485 | -0.8% | 21.3% |
| *NOTE: March 2015 had 25 selling days, March 2014 had 26 and February 2015 had 24. |
Edmunds.com estimates that retail SAAR will come in at 13.5 million vehicles in March, with fleet transactions accounting for 20.4 percent of total sales. An estimated 3.5 million used cars will be sold in March, for a SAAR of 35.5 million (compared to 3.2 million – or a SAAR of 35.7 million – used car sales in February.)
| MARKET SHARE FORECAST, BY MANUFACTURER | |||||
|
Market Share | March 2015 Forecast | March 2014 | February 2015 | Change from March 2014 | Change from February 2015 |
| GM | 16.6% | 16.7% | 18.4% | -0.1% | -1.8% |
| Ford | 15.1% | 15.9% | 14.3% | -0.7% | 0.8% |
| Toyota | 14.7% | 14.0% | 14.4% | 0.7% | 0.4% |
| Chrysler Group | 13.1% |
12.7% | 13.0% | 0.4% | 0.1% |
| Nissan | 9.3% | 9.7% | 9.4% | -0.5% | -0.2% |
| Honda | 8.5% | 8.7% | 8.4% | -0.2% | 0.1% |
| Hyundai/Kia | 7.7% | 7.9% | 7.7% | -0.3% | 0.0% |
| VW/Audi | 3.1% | 3.3% | 3.0% | -0.2% | 0.2% |