

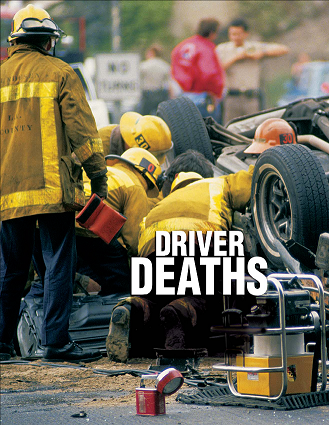
Death Rates In Auto Accidents Drop - IIHS Credits Improved Vehicle Design
 |
Arlington, VA January 29, 2015; The IIHS reported that the chances of dying in a crash in a late-model vehicle have fallen by more than a third in three years, the latest IIHS calculations of driver death rates show. Among 2011 models, a record nine vehicles have driver death rates of zero. However, the gap between the safest and riskiest models remains wide, and three cars have death rates exceeding 100 per million registered vehicle years.
Improved vehicle designs and safety technology have a lot to do with the continuing decline in fatality risk. In a related study, Institute researchers estimated how much of the decline was due to changes in the vehicle fleet during 1985-2012. They found that vehicle changes — including improved structural designs, the addition of safety features and an evolving mix of vehicle types — were the main source of declining risk from 1993 through 2006. These changes continued to contribute to later declines as well, though other factors such as the weak economy also appear to have played a role.
There were 7,700 fewer driver deaths in 2012 alone than there would have been had vehicles remained the same since 1985.
The latest death rates by make and model confirm the rapid pace of improvement. Among 2011 models, there were 28 driver deaths per million registered vehicle years through the 2012 calendar year, down from 48 for 2008 models through 2009 (see "Death rates by model: SUV drivers are among least likely to be killed," June 9, 2011). A registered vehicle year is one vehicle registered for one year.
"This is a huge improvement in just three years, even considering the economy's influence," says David Zuby, IIHS executive vice president and chief research officer. "We know from our vehicle ratings program that crash test performance has been getting steadily better. These latest death rates provide new confirmation that real-world outcomes are improving, too."
Although the numbers reflect 2011 models, data from earlier model-year vehicles as far back as 2008 are included if the vehicles weren't substantially redesigned before 2011. Including older, equivalent vehicles increases the exposure and thus the accuracy of the results. To be included, a vehicle must have had at least 100,000 registered vehicle years of exposure during 2009-12 or at least 20 deaths.
IIHS has published death rates by make and model periodically since 1989, at first for cars only and later for all passenger vehicles (see Status Report special issue: death rates, Nov. 25, 1989). The rates include only driver deaths because the presence of passengers is unknown. Fatality counts are taken from the federal Fatality Analysis Reporting System. Registration data are from R.L. Polk & Co.
The rates are adjusted for driver age and gender, but not all the demographic factors that can influence results are accounted for. Four years ago when IIHS released death rates for 2008 models, researchers found that they needed to include an adjustment for calendar year in order to account for the effects of the recession. For this reason, researchers developed another model that included the calendar year adjustment, as well as adjustments for vehicle age and vehicle density at the garaging location, in addition to driver age and gender. That more-complex model worked well at the time, but when researchers used it to calculate the 2011 death rates, the results were unstable. Since the U.S. economy didn't see such large fluctuations during the new time period, the researchers went back to the previous model.
Getting to zero
The list of models with the lowest death rates illustrates just how much vehicles have improved. Eight years ago, there were no models with driver death rates of zero (see Status Report special issue: driver death rates, April 19, 2007). Now there are nine. These vehicles — which include several luxury models but also some less expensive ones such as the Kia Sorento midsize SUV and the Subaru Legacy sedan — had no driver deaths during the calendar years studied.
The presence of so many zeros among the latest death rates comes at a time when more and more highway safety advocates are setting their sights on a goal of zero deaths in motor vehicle crashes. Sweden has been working toward eliminating crash deaths since its parliament formally adopted a "Vision Zero" policy in 1997. New York City now has its own Vision Zero plan. The Governors Highway Safety Association unveiled a plan titled "Toward Zero Deaths" in 2009.
"The complete elimination of traffic deaths is still many decades away, and, along with vehicle improvements, getting there will require changes in road design and public policy that can help protect all road users," Zuby says. "Still, the rise in the number of vehicles with zero driver deaths shows what's possible."
One striking thing about the group of zero-death vehicles — aside from the sheer number — is that two-thirds of them are SUVs.
A decade ago, SUVs had some of the highest rates, due to their propensity to roll over (see Status Report special issue: driver death rates, March 19, 2005). However, the spread of electronic stability control (ESC) through the fleet has dramatically lessened the risk of rollover crashes in these and all vehicles. The rollover death rate of 5 per million registered vehicle years for 2011 models is less than a quarter of what it was for 2004 models.
With ESC dramatically reducing rollover risk, the inherent advantages offered by SUVs' greater size, weight and height emerge more clearly. Today's SUVs have the lowest driver death rate of any vehicle type.
Small vehicles, high death rates
The vehicle with the highest death rate among the 2011 models is the Kia Rio, a minicar, with 149 driver deaths per million registered vehicle years. It's one of only three vehicles with death rates above 100.
Minicars and small cars dominate the worst list. That's not surprising, since these vehicles can't protect as well as larger ones. Death rates by vehicle type and size show that the smallest vehicles typically have the highest death rates, and, with some exceptions, death rates tend to go down as size goes up.
The effect of vehicle design
The driver death rates IIHS publishes allow consumers to compare specific vehicles. They also show differences among various classes and sizes of vehicles. What they don't do is show what portion of the overall decline in deaths can be attributed to a changing vehicle mix, improvements in vehicle design and the spread of technology like ESC, and what portion is due to other factors such as improvements in driver behavior resulting from changes in traffic laws and enforcement or from safer intersections and road designs.
To answer that question, IIHS researchers updated a 2006 study that predicted what would have happened to driver death rates if vehicles had not changed (see "Improving vehicle designs help push down death rate," April 22, 2006).
As they did in the earlier study, the authors estimated the effect of vehicle age and calendar year on death rates. Calendar year differences are assumed to be due to factors common to all vehicles — for example, weather or laws affecting driver behavior. By controlling for these effects, the authors were able to isolate the effects of vehicle changes.
The researchers found that 1985-95 fleets weren't as protective of their drivers as the 1984 fleet, but vehicles steadily improved after that. From 1993 through 2006, vehicle changes were the main source of the decline in driver death risk. Had vehicles not improved during that time, the longstanding downward trend of driver fatality rates would have ended in 1993.
Driver deaths per million registered passenger
vehicles
and expected rates if vehicles had not changed
The yellow line shows what would have happened to death rates if vehicles hadn't changed over the years. Death rates would have crept up between 1993 and 2006 instead of continuing their steady fall.
"In some ways, the '90s weren't a great time for highway safety policy. Speed limits increased, and belt use gains leveled off," says IIHS President Adrian Lund, a co-author of both the 2006 study and the new one. "However, consumers began to think more about the safety of vehicles, thanks at least in part to the increasing availability of crash test ratings from both the National Highway Traffic Safety Administration and the Institute. Manufacturers responded to the ratings by making improvements, and this process has accelerated in recent years, thanks to shorter design cycles."
While the number of lives saved from vehicle improvements is good news, the flip side of the study is the missed opportunities for reducing fatality risk by other means. Lower speed limits, stronger safety belt laws and wider use of automated enforcement are just a few examples of policies that could have reduced the death toll even further (see "Low-hanging fruit: Existing countermeasures merit renewed attention," Aug. 18, 2011).
Since 2006, improvements in vehicle design have continued to play a big role in declining fatality risk, though the risk would have fallen somewhat even without vehicle changes, the study shows. A small increase in safety belt use and other improvements in driver behavior may have contributed to this reduced risk by calendar year, but the biggest factor was probably the weak economy. This means that fatality rates could be expected to rise again when the economy improves unless better traffic safety policies are put in place.
| � | Overall
driver deaths
per million registered vehicle years | Multiple-vehicle
crashes | Single-vehicle
crashes | Single-vehicle
rollovers |
|---|---|---|---|---|
| CARS | 38 | 22 | 16 | 6 |
| 4-DOOR | � | � | � | � |
| mini | 115 | 71 | 44 | 13 |
| small | 51 | 28 | 22 | 11 |
| midsize | 29 | 19 | 10 | 4 |
| large | 34 | 21 | 14 | 3 |
| very large | 24 | 15 | 9 | 0 |
| 2-DOOR | � | � | � | � |
| mini | 54 | 33 | 22 | 8 |
| small | 71 | 42 | 27 | 12 |
| midsize | 43 | 32 | 8 | 3 |
| large | 37 | 0 | 37 | 22 |
| SPORTS | � | � | � | � |
| small | 0 | 0 | 0 | 0 |
| midsize | 50 | 19 | 32 | 16 |
| large | 67 | 15 | 51 | 22 |
| LUXURY | � | � | � | � |
| midsize | 14 | 5 | 10 | 5 |
| large | 26 | 13 | 12 | 3 |
| very large | 10 | 8 | 1 | 0 |
| STATION WAGONS | � | � | � | � |
| mini | 37 | 35 | 3 | 3 |
| small | 41 | 25 | 16 | 7 |
| midsize | 7 | 4 | 3 | 2 |
| MINIVANS | 23 | 17 | 5 | 2 |
| SUVs | 18 | 9 | 9 | 4 |
| 4-WHEEL DRIVE | � | � | � | � |
| small | 22 | 11 | 11 | 3 |
| midsize | 16 | 7 | 9 | 4 |
| large | 8 | 3 | 4 | 2 |
| very large | 18 | 10 | 7 | 4 |
| 2-WHEEL DRIVE | � | � | � | � |
| small | 32 | 20 | 11 | 4 |
| midsize | 17 | 7 | 9 | 4 |
| large | 15 | 8 | 7 | 4 |
| very large | 31 | 15 | 15 | 6 |
| 4-WHEEL DRIVE LUXURY | � | � | � | � |
| midsize | 10 | 5 | 4 | 1 |
| large | 13 | 2 | 12 | 8 |
| very large | 17 | 9 | 8 | 0 |
| 2-WHEEL DRIVE LUXURY | � | � | � | � |
| midsize | 15 | 7 | 8 | 3 |
| PICKUPS | 29 | 15 | 14 | 5 |
| 4-WHEEL DRIVE | � | � | � | � |
| small | 32 | 14 | 18 | 6 |
| large | 29 | 14 | 15 | 6 |
| very large | 39 | 15 | 24 | 14 |
| 2-WHEEL DRIVE | � | � | � | � |
| small | 29 | 18 | 10 | 5 |
| large | 26 | 15 | 11 | 2 |
| � | � | � | Overall driver deaths per million
registered vehicle years | Multiple-vehicle
crashes | Single-vehicle
crashes | Single-vehicle
rollovers |
|---|---|---|---|---|---|---|
| Audi A4 4WD | luxury car | midsize | 0 | 0 | 0 | 0 |
| Honda Odyssey | minivan | very large | 0 | 0 | 0 | 0 |
| Kia Sorento 2WD | SUV | midsize | 0 | 0 | 0 | 0 |
| Lexus RX 350 4WD | luxury SUV | midsize | 0 | 0 | 0 | 0 |
| Mercedes-Benz GL-Class 4WD | luxury SUV | large | 0 | 0 | 0 | 0 |
| Subaru Legacy 4WD | 4-door car | midsize | 0 | 0 | 0 | 0 |
| Toyota Highlander hybrid 4WD | SUV | midsize | 0 | 0 | 0 | 0 |
| Toyota Sequoia 4WD | SUV | large | 0 | 0 | 0 | 0 |
| Volvo XC90 4WD | luxury SUV | midsize | 0 | 0 | 0 | 0 |
| Honda Pilot 4WD | SUV | midsize | 2 | 0 | 2 | 0 |
| Mercedes-Benz M-Class 4WD | luxury SUV | midsize | 3 | 3 | 0 | 0 |
| Ford Crown Victoria | 4-door car | very large | 4 | 4 | 0 | 0 |
| GMC Yukon 4WD | SUV | large | 4 | 0 | 4 | 0 |
| Acura TL 2WD | luxury car | midsize | 5 | 5 | 0 | 0 |
| Chevrolet Equinox 2WD | SUV | midsize | 5 | 3 | 2 | 0 |
| Chevrolet Equinox 4WD | SUV | midsize | 5 | 5 | 0 | 0 |
| Ford Expedition 4WD | SUV | large | 5 | 5 | 0 | 0 |
| Ford Flex 2WD | SUV | midsize | 5 | 0 | 5 | 0 |
| Mazda CX-9 4WD | SUV | midsize | 5 | 0 | 5 | 5 |
| 2WD: 2-wheel drive; 4WD: 4-wheel drive | ||||||
| � | � | � | Overall driver deaths per million registered vehicle years | Multiple-vehicle crashes | Single-vehicle crashes | Single-vehicle rollovers |
|---|---|---|---|---|---|---|
| Kia Rio | 4-door car | mini | 149 | 96 | 54 | 15 |
| Nissan Versa sedan | 4-door car | small | 130 | 44 | 87 | 51 |
| Hyundai Accent | 4-door car | mini | 120 | 65 | 53 | 16 |
| Chevrolet Aveo | 4-door car | mini | 99 | 65 | 31 | 10 |
| Hyundai Accent | 2-door car | mini | 86 | 43 | 48 | 20 |
| Chevrolet Camaro coupe | sports car | large | 80 | 19 | 60 | 25 |
| Chevrolet Silverado 1500 Crew 4WD | pickup | large | 79 | 40 | 36 | 17 |
| Honda Civic | 2-door car | small | 76 | 46 | 29 | 10 |
| Nissan Versa hatchback | 4-door car | small | 71 | 37 | 33 | 20 |
| Ford Focus | 4-door car | small | 70 | 55 | 13 | 5 |
| Nissan Cube | station wagon | small | 66 | 38 | 29 | 6 |
| Chevrolet HHR | station wagon | small | 61 | 34 | 25 | 9 |
| Chevrolet Suburban 1500 2WD | SUV | very large | 60 | 31 | 28 | 9 |
| Chevrolet Aveo | station wagon | mini | 58 | 58 | 0 | 0 |
| Mercury Grand Marquis | 4-door car | very large | 57 | 33 | 25 | 0 |
| Jeep Patriot 2WD | SUV | small | 57 | 44 | 9 | 3 |
| Mazda 6 | 4-door car | midsize | 54 | 34 | 17 | 3 |
| Dodge Nitro 2WD | SUV | midsize | 51 | 7 | 50 | 40 |
| Honda Civic | 4-door car | small | 49 | 28 | 21 | 8 |
| 2WD: 2-wheel drive; 4WD: 4-wheel drive | ||||||
 |