Auto Sales to Reach Highest July Mark in Eight Years
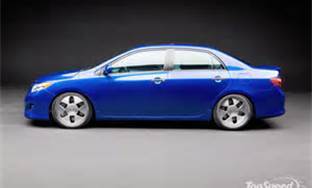
 2014 Toyota Corolla |
SANTA MONICA, CA --July 24, 2014: Edmunds.com forecasts that 1,461,290 new cars and trucks will be sold in the U.S. in July, for an estimated Seasonally Adjusted Annual Rate (SAAR) of 16.8 million. This would be the highest July sales since the auto industry delivered 1.49 million new car sales in July 2006.
"July's performance is the clearest indication yet that retail buyers are driving market demand," says Edmunds.com Senior Analyst Jessica Caldwell. "Shoppers are looking past news of recalls and rising gas prices and they're finding affordable interest rates and other incentives that make it easier to buy a new car."
| SALES VOLUME FORECAST, BY MANUFACTURER
| |||||
| Sales Volume | Jul-14 Forecast | Jul-13 |
Jun-14 | Change from Jul 2013* | Change from Jun 2014* |
| GM | 258,966 | 234,071 | 267,461 | 10.6% | -3.2% |
| Toyota | 217,314 | 193,394 | 201,714 | 12.4% | 7.7% |
| Ford | 212,714 | 193,080 | 221,396 | 10.2% | -3.9% |
| Chrysler Group | 170,659 | 140,102 | 171,086 | 21.8% | -0.2% |
| Honda | 144,701 | 141,439 | 129,023 | 2.3% | 12.2% |
| Hyundai/Kia | 126,937 | 115,009 | 118,051 | 10.4% | 7.5% |
| Nissan | 123,653 | 109,041 | 109,643 | 13.4% | 12.8% |
| VW/Audi | 48,379 | 48,843 | 45,694 | -0.9% | 5.9% |
| Industry | 1,461,290 | 1,314,891 | 1,419,090 | 11.1% | 3.0% |
| *NOTE: July 2014 had 26 selling days, July 2013 had 25 and June 2014 had 24. | |||||
Edmunds.com estimates that retail SAAR will come in at 14.5 million vehicles in July, with fleet transactions accounting for 13.8 percent of total sales. An estimated 3.22 million used cars will be sold in July, for a SAAR of 36.2 million (compared to 2.94 million – or a SAAR of 36.7 million – used car sales in June).
AUTOMAKER PERFORMANCE
Edmunds.com projects that Toyota will post the most notable sales performance in July. The forecast anticipates that the Japanese automaker will see sales grow 12.4 percent year over year and 7.7 percent month over month. As a result, Toyota is poised to surpass Ford as the second best-selling manufacturer for the first month since August 2013.
| MARKET SHARE FORECAST, BY MANUFACTURER
| |||||
| Market Share | Jul-14 Forecast | Jul-13 | Jun-14 | Change from July
2013 (Percentage pts.) | Change from June 2014 (Percentage pts.) |
| GM | 17.7% | 17.8% | 18.8% | -0.1% | -1.1% |
| Toyota | 14.9% | 14.7% | 14.2% | 0.2% | 0.7% |
| Ford | 14.6% | 14.7% | 15.6% | -0.1% | -1.0% |
| Chrysler Group | 11.7% | 10.7% | 12.1% | 1.0% | -0.4% |
| Honda | 9.9% | 10.8% | 9.1% | -0.9% | 0.8% |
| Hyundai/Kia | 8.7% | 8.7% | 8.3% | -0.1% | 0.4% |
| Nissan | 8.5% | 8.3% | 7.7% | 0.2% | 0.7% |
| VW/Audi | 3.3% | 3.7% | 3.2% | -0.4% | 0.1% |


