

Toyota Motor Sales Continues To See Steady Growth In February
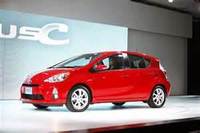 2013 Toyota Prius |
All-new Avalon and RAV4 post record sales; Trucks outperform cars
TORRANCE, CA--March 1, 2013: ĀToyota Motor Sales (TMS), U.S.A., Inc., today reported February 2013 sales results of 166,377 units, an increase of 8.7 percent on a daily selling rate (DSR) basis. Unadjusted for 24 selling days in February 2013 versus 25 in February 2012, TMS sales were up 4.3 percent over the year-ago month.Ā Ā
Toyota Division posted February total sales of 149,038 units, up 8.7 percent year-over-year on a DSR basis.Ā Volume-wise, Toyota Division sales increased 4.4 percent over February 2012.Ā
"Despite rising gas prices, severe winter storms and concerns about the federal budget, February was a good indication of the overall strength of the market," said Bill Fay, group vice president and general manager, Toyota Division. "With the most fuel efficient full line of vehicles, Toyota is well positioned, and we're encouraged by very positive consumer reaction to our new Avalon and RAV4."
Lexus Division reported February total sales of 17,339, up 8.3 percent on a DSR basis and up 3.9 percent by raw volume, compared to the same period last year.Ā
Other Highlights:
- Avalon posted its best month since November 2007, up 63.1 percent with sales of 5,703 units
- RAV4, bolstered by sales of the all-new 2014 model, recorded its best-ever February with sales of 13,329 units, up 5.1 percent
- Corolla sales of Ā24,999 units were up 12.9 percent
- Camry posted sales of 31,270 units, while the Prius Family recorded sales of 17,812
- Total TMS truck sales of 70,051 units, up 16.1 percent
- Total TMS Hybrid sales were 26,966 units, up 2.3 percent on a DSR basis
- Both Tundra and Highlander posted their best February sales since 2008, up 15.5 and 14.1 percent, respectively
- Tacoma recorded sales of 12,644 units, up 18.5 percent, its best February since 2008
- Lexus RX sales of 6,938, up 19.8 percent
- Lexus ES sales of 4,817, up 60.7 percent
*Note:Ā Unless otherwise stated, all figures reflect unadjusted raw sales volume (compared to the year-ago month).
|
TOYOTAĀ U.S. SALES SUMMARY |
||||||||
|
February, 2013 |
||||||||
|
|
|
|
|
|
|
|
|
|
|
|
-- CURRENT MONTH -- |
-- CALENDAR YEAR TO DATE -- |
||||||
|
|
|
|
DSR % |
VOL %Ā |
|
|
DSR % |
VOL %Ā |
|
|
2013 |
2012 |
CHG |
CHGĀ |
2013 |
2012 |
CHG |
CHGĀ |
|
TOTAL TOYOTA |
166,377 |
159,462 |
8.7 |
4.3 |
324,102 |
284,002 |
14.1 |
14.1 |
|
TOTAL TOYOTA DIV. |
149,038 |
142,780 |
8.7 |
4.4 |
290,552 |
255,046 |
13.9 |
13.9 |
|
TOTAL LEXUS |
17,339 |
16,682 |
8.3 |
3.9 |
33,550 |
28,956 |
15.9 |
15.9 |
|
|
|
|
|
|
|
|
|
|
|
YARIS |
2,045 |
3,612 |
-41.0 |
43.4 |
4,942 |
6,622 |
-25.4 |
-25.4 |
|
COROLLA |
24,999 |
22,151 |
17.6 |
12.9 |
48,821 |
40,139 |
21.6 |
21.6 |
|
PRIUS |
17,812 |
20,593 |
-9.9 |
13.5 |
33,584 |
32,148 |
4.5 |
4.5 |
|
CAMRY |
31,270 |
34,543 |
-5.7 |
-9.5 |
63,167 |
62,838 |
0.5 |
0.5 |
|
AVALON |
5,703 |
3,497 |
69.9 |
63.1 |
10,543 |
6,716 |
57.0 |
57.0 |
|
SCION FR-S |
1,369 |
0 |
NA |
NA |
2,812 |
0 |
NA |
NA |
|
SCION iQ |
331 |
864 |
-60.1 |
61.7 |
626 |
1,238 |
-49.4 |
-49.4 |
|
SCION xD |
596 |
818 |
-24.1 |
27.1 |
1,220 |
1,470 |
-17.0 |
-17.0 |
|
SCION xB |
1,512 |
1,611 |
-2.2 |
-6.1 |
2,779 |
2,811 |
-1.1 |
-1.1 |
|
SCION tC |
1,244 |
1,649 |
-21.4 |
24.6 |
2,508 |
2,958 |
-15.2 |
-15.2 |
|
TOTAL SCION |
5,052 |
4,942 |
6.5 |
2.2 |
9,945 |
8,477 |
17.3 |
17.3 |
|
TOTAL TOYOTA DIV. CAR |
86,881 |
89,338 |
1.3 |
-2.8 |
171,002 |
156,940 |
9.0 |
9.0 |
|
|
|
|
|
|
|
|
|
|
|
CT |
1,182 |
1,642 |
-25.0 |
28.0 |
2,183 |
2,667 |
-18.1 |
-18.1 |
|
HS |
1 |
150 |
-99.3 |
99.3 |
1 |
302 |
-99.7 |
-99.7 |
|
IS |
1,532 |
2,095 |
-23.8 |
26.9 |
2,918 |
3,905 |
-25.3 |
-25.3 |
|
ES |
4,817 |
2,997 |
67.4 |
60.7 |
10,003 |
5,407 |
85.0 |
85.0 |
|
GS |
1,108 |
2,397 |
-51.8 |
53.8 |
2,207 |
2,490 |
-11.4 |
-11.4 |
|
LS |
803 |
517 |
61.8 |
55.3 |
1,880 |
1,090 |
72.5 |
72.5 |
|
SC |
0 |
0 |
NA |
NA |
0 |
2 |
-100.0 |
100.0 |
|
LFA |
2 |
6 |
-65.3 |
66.7 |
5 |
10 |
-50.0 |
-50.0 |
|
TOTAL LEXUS CAR |
9,445 |
9,804 |
0.4 |
-3.7 |
19,197 |
15,873 |
20.9 |
20.9 |
|
TOTAL TOYOTA CAR |
96,326 |
99,142 |
1.2 |
-2.8 |
190,199 |
172,813 |
10.1 |
10.1 |
|
|
|
|
|
|
|
|
|
|
|
RAV4 |
13,329 |
12,679 |
9.5 |
5.1 |
24,939 |
22,498 |
10.8 |
10.8 |
|
FJ CRUISER |
1,355 |
1,047 |
34.8 |
29.4 |
2,587 |
1,755 |
47.4 |
47.4 |
|
VENZA |
3,745 |
2,671 |
46.1 |
40.2 |
7,116 |
5,131 |
38.7 |
38.7 |
|
HIGHLANDER |
9,310 |
8,156 |
18.9 |
14.1 |
18,141 |
15,012 |
20.8 |
20.8 |
|
4RUNNER |
3,979 |
3,070 |
35.0 |
29.6 |
8,464 |
5,989 |
41.3 |
41.3 |
|
SIENNA |
9,209 |
7,655 |
25.3 |
20.3 |
16,990 |
13,960 |
21.7 |
21.7 |
|
SEQUOIA |
1,064 |
1,040 |
6.6 |
2.3 |
2,244 |
2,108 |
6.5 |
6.5 |
|
LAND CRUISER |
216 |
122 |
84.4 |
77.0 |
493 |
241 |
104.6 |
104.6 |
|
TOTAL TOYOTA DIV. SUV |
32,998 |
28,785 |
19.4 |
14.6 |
63,984 |
52,734 |
21.3 |
21.3 |
|
|
|
|
|
|
|
|
|
|
|
TACOMA |
12,644 |
10,674 |
23.4 |
18.5 |
24,266 |
19,572 |
24.0 |
24.0 |
|
TUNDRA |
7,306 |
6,328 |
20.3 |
15.5 |
14,310 |
11,840 |
20.9 |
20.9 |
|
TOTAL TOYOTA DIV. PICKUP |
19,950 |
17,002 |
22.2 |
17.3 |
38,576 |
31,412 |
22.8 |
22.8 |
|
TOTAL TOYOTA DIV. TRUCK |
62,157 |
53,442 |
21.2 |
16.3 |
119,550 |
98,106 |
21.9 |
21.9 |
|
|
|
|
|
|
|
|
|
|
|
RX |
6,938 |
5,792 |
24.8 |
19.8 |
12,332 |
10,830 |
13.9 |
13.9 |
|
GX |
628 |
703 |
-6.9 |
10.7 |
1,361 |
1,581 |
-13.9 |
-13.9 |
|
LX |
328 |
383 |
-10.8 |
14.4 |
660 |
672 |
-1.8 |
-1.8 |
|
TOTAL LEXUS TRUCK |
7,894 |
6,878 |
19.6 |
14.8 |
14,353 |
13,083 |
9.7 |
9.7 |
|
TOTAL TOYOTA TRUCK |
70,051 |
60,320 |
21.0 |
16.1 |
133,903 |
111,189 |
20.4 |
20.4 |
|
|
|
|
|
|
|
|
|
|
|
SELLING DAYS |
24 |
25 |
|
|
49 |
49 |
|
|
|
DSR = DAILY SELLING RATE |
|
|
|
|
|
|
||
|
TOYOTAĀ U.S. SALES SUMMARY |
||||||||
|
February, 2013 |
||||||||
|
|
|
|
|
|
|
|
|
|
|
|
-- CURRENT MONTH -- |
-- CALENDAR YEAR TO DATE -- |
||||||
|
|
|
|
DSR % |
VOL %Ā |
|
|
DSR % |
VOL %Ā |
|
|
2013 |
2012 |
CHG |
CHGĀ |
2013 |
2012 |
CHG |
CHGĀ |
|
* NORTH AMERICAN BUILT VEHICLES |
|
|
|
|
|
|
|
|
|
|
|
|
|
|
|
|
|
|
|
COROLLA |
24,936 |
19,098 |
36.0 |
30.6 |
48,708 |
34,708 |
40.3 |
40.3 |
|
CAMRY |
31,257 |
34,526 |
-5.7 |
-9.5 |
63,139 |
62,803 |
0.5 |
0.5 |
|
AVALON |
5,703 |
3,497 |
69.9 |
63.1 |
10,543 |
6,716 |
57.0 |
57.0 |
|
RAV4 |
7,652 |
11,088 |
-28.1 |
31.0 |
16,410 |
19,548 |
-16.1 |
-16.1 |
|
VENZA |
3,745 |
2,671 |
46.1 |
40.2 |
7,116 |
5,131 |
38.7 |
38.7 |
|
HIGHLANDER |
8,844 |
7,640 |
20.6 |
15.8 |
17,191 |
14,091 |
22.0 |
22.0 |
|
SIENNA |
9,209 |
7,655 |
25.3 |
20.3 |
16,990 |
13,960 |
21.7 |
21.7 |
|
SEQUOIA |
1,064 |
1,040 |
6.6 |
2.3 |
2,244 |
2,108 |
6.5 |
6.5 |
|
TACOMA |
12,644 |
10,674 |
23.4 |
18.5 |
24,266 |
19,572 |
24.0 |
24.0 |
|
TUNDRA |
7,306 |
6,328 |
20.3 |
15.5 |
14,310 |
11,840 |
20.9 |
20.9 |
|
|
|
|
|
|
|
|
|
|
|
RX |
5,925 |
4,629 |
33.3 |
28.0 |
10,162 |
8,230 |
23.5 |
23.5 |
|
|
|
|
|
|
|
|
|
|
|
TOTAL |
118,285 |
108,846 |
13.2 |
8.7 |
231,079 |
198,707 |
16.3 |
16.3 |
|
N.A. VEHICLES % OF TOTAL |
71.1% |
68.3% |
|
|
71.3% |
70.0% |
|
|
|
|
|
|
|
|
|
|
|
|
|
TOYOTA DIV. IMPORT CAR |
24,985 |
32,217 |
-19.2 |
22.4 |
48,612 |
52,713 |
-7.8 |
-7.8 |
|
LEXUS IMPORT CAR |
9,445 |
9,804 |
0.4 |
-3.7 |
19,197 |
15,873 |
20.9 |
20.9 |
|
TOYOTA DIV NA BUILT CARS |
61,896 |
57,121 |
12.9 |
8.4 |
122,390 |
104,227 |
17.4 |
17.4 |
|
TOTAL TOYOTA CARS |
96,326 |
99,142 |
1.2 |
-2.8 |
190,199 |
172,813 |
10.1 |
10.1 |
|
|
|
|
|
|
|
|
|
|
|
TOYOTA DIV. IMPORT TRUCK |
11,693 |
6,346 |
91.9 |
84.3 |
21,023 |
11,856 |
77.3 |
77.3 |
|
LEXUS IMPORT TRUCK |
1,969 |
2,249 |
-8.8 |
12.4 |
4,191 |
4,853 |
-13.6 |
-13.6 |
|
TOYOTA DIV NA BUILT TRUCK |
50,464 |
47,096 |
11.6 |
7.2 |
98,527 |
86,250 |
14.2 |
14.2 |
|
LEXUS NA BUILT TRUCK |
5,925 |
4,629 |
33.3 |
28.0 |
10,162 |
8,230 |
23.5 |
23.5 |
|
TOTAL TOYOTA TRUCK |
70,051 |
60,320 |
21.0 |
16.1 |
133,903 |
111,189 |
20.4 |
20.4 |
|
|
|
|
|
|
|
|
|
|
|
SELLING DAYS |
24 |
25 |
|
|
49 |
49 |
|
|
|
DSR = DAILY SELLING RATE |
|
|
|
|
|
|
||
|
|
|
|
|
|
|
|
|
|
|
|
--CURRENT MONTH-- |
|
--CALENDAR YEAR TO DATE-- |
|
||||
|
Memo: |
2013 |
2012 |
DSR % D |
|
2013 |
2012 |
DSR % D |
|
|
Toyota Prius Sedan |
11,428 |
16,469 |
-27.7% |
|
21,113 |
24,969 |
-15.4% |
|
|
Toyota Prius V (only) |
2,543 |
4,083 |
-35.1% |
|
5,065 |
7,138 |
-29.0% |
|
|
Toyota Prius C (only) |
3,148 |
20 |
16295.8% |
|
5,839 |
20 |
29095.0% |
|
|
Toyota Prius Phv (only) |
693 |
21 |
3337.5% |
|
1,567 |
21 |
7361.9% |
|
|
|
|
|
|
|
|
|
|
|
Ā