

More Than One-Third Say Traffic Congestion is a Serious Problem in Their Community
 |
Over half of those in the Western Region of the United States say traffic is a serious problem
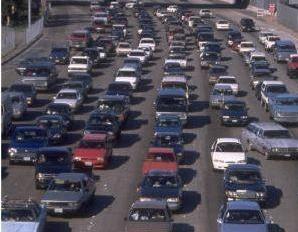
ROCHESTER, N.Y., Feb. 22 -- Unfortunately, traffic congestion and their accompanying delays are a fact of life in many communities and for many U.S. adults. Just over one-third (37%) say that traffic congestion is a serious problem in their community, while one-quarter say traffic congestion is a serious problem that is not being addressed. 12 percent say it is a serious problem that is being addressed. Just under two in five (39%) say traffic is a moderate problem and 21 percent say it is not a problem at all.
This is definitely a case of region playing a role. Just one-quarter (26%) of those who live in the Midwest and 32 percent of those in the South say traffic congestion is a serious problem. In the East, over one-third (37%) say traffic congestion is a serious problem. Compare this to the West where over half (56%) believe traffic congestion is a serious problem.
These are some of the results of a Harris Poll of 2,337 U.S. adults conducted online between January 11 and 18, 2007 by Harris Interactive(R).
Would the United States Accept A Congestion Tax?
Recently, the city of London introduced its controversial "congestion tax" as a way to help reduce traffic levels and all that accompanies it, many people around the world watched to see if the public would accept the policy. While it seems to be going smoothly in London, U.S. adults do not appear to be as ready to embrace such a congestion tax in their cities.
When it comes to imposing a congestion tax in U.S. cities, two-thirds (66%) of adults oppose such a tax with half (51%) saying they strongly oppose it. Just 22 percent say they support it. Even among those who say traffic in their community is a serious problem most would not support such a tax. Only three in ten (29%) of those who say traffic is a serious problem support a congestion tax while 61 percent oppose it. This may be an issue of the importance of cars to Americans and the lack of good public transportation in many U.S. cities, not just a case of not wanting to pay another tax.
,b>Home Purchases Can Lead to Reduced Energy Costs
Harris Interactive also asked people if they would be willing to pay a higher price for a new house that would reduce energy use and could also reduce their monthly heating and cooling bills. Seven in ten U.S. adults say they would be willing to pay more for such a house and only 19 percent said they would not be willing. However, people were not asked how much more they would be willing to pay.
  Other findings in this Harris Poll include:

  -- Over two in five (44%) of those who use public transportation to get to
     work say traffic congestion is a serious and unaddressed problem in
     their community while less than one-quarter (23%) of those who drive
     themselves share this sentiment. This may reflect the greater use of
     public transportation in larger cities;
  -- Just over half (55%) of adults drive themselves to work while only 4
     percent each take public transportation, walk or are part of a carpool;
  -- Those in the East are more likely to drive themselves to work (58%) and
     are also more likely to take public transportation (8%), while seven
     percent of those in the West say they are part of a carpool.
  -- Six in ten (61%) of U.S. adults say they are concerned about global
     warming while 35 percent are not concerned. There is a gender
     difference on this issue as two-thirds of women (67%) say they are
     concerned while just 55 percent of men say they are concerned about
     global warming;
  -- When it comes to spending more for a home that would reduce energy
     costs, Baby Boomers and Echo Boomers are slightly more likely than
     other generations (73% and 72% respectively) to say they would be
     willing to do this.

                                 TABLE 1
                            TRAFFIC CONGESTION
  "In your opinion, how serious a problem is traffic congestion in your
                               community?"
  Base: All adults

                     Total         Region              How get to work
                                                            Use Public  Bike
                                Mid-            Drive Car-    Trans-     or
                           East west South West self  pool  portation   Walk
                        %    %     %     %   %    %      %      %         %
  SERIOUS PROBLEM
   (NET)               37   36    26    32  56   36     37      55       33
    A serious problem
     and it is not
     being addressed   25   28    16    19  39   23     30      44       22
    A serious problem,
     but it is being
     addressed         12    9    10    13  17   13      7      11       11
  A moderate problem   39   42    43    41  29   44     26      36       34
  Not a problem        21   20    27    23  12   18     37       9       21
  Not sure              3    2     4     4   3    1      -       *       11

  Note: Percentages may not add up to exactly 100% due to rounding.
  "-" No response
  *Less Than 0.5%

                                 TABLE 2
                        SUPPORT FOR CONGESTION TAX
"Some cities, such as London, currently use a congestion tax to help reduce traffic congestion. All drivers that travel within the boundaries pay a daily
charge to enter the zone. Would you support or oppose U.S. cities imposing
                               such a tax?"
  Base: All adults

                           Total          Traffic in their community
                                       Serious problem       Moderate or not
                                                                  a problem
                               %                   %                     %
  Support (NET)               22                  29                    19
     Strongly support          5                   8                     3
     Somewhat support         17                  22                    15
  Oppose (NET)                66                  61                    71
     Somewhat oppose          16                  15                    17
     Strongly oppose          51                  46                    55
  Not sure                    12                  10                    10

  Note: Percentages may not add up to exactly 100% due to rounding.

                                 TABLE 3
                   SPENDING MORE TO REDUCE ENERGY COSTS
"Would you be willing to pay a higher price for a new house or condo that
would reduce energy use and could reduce your monthly heating and cooling
                                 bills?"
  Base: All adults

                               Total               Generation
                                         Echo       Gen     Baby     Matures
                                       Boomers     Xers    Boomers   (62 and
                                       (18-30)    (31-42)  (43-61)    over)
                                  %         %         %         %        %
  WILLING (NET)                  70        72        66        73       69
     Definitely would be
      willing                    23        21        24        24       22
     Probably would be willing   47        50        42        50       46
  NOT WILLING (NET)              19        14        21        19       21
     Probably would not be
      willing                    12        12        13        11       14
     Definitely would not be
      willing                     7         3         7         8        7
  Not sure                       11        14        14         8       10

  Note: Percentages may not add up to exactly 100% due to rounding.

                                 TABLE 4
CONCERN OVER GLOBAL WARMING "How concerned are you with the long-term effects of global warming or global
                             climate change?"
  Base: All adults

                                            Total           Gender
                                                       Men           Women
                                                %        %               %
  Concerned (NET)                              61       55              67
     Very concerned                            36       34              37
     Somewhat concerned                        25       21              29
  Not concerned (NET)                          35       42              29
     A little concerned                        19       19              18
     Not at all concerned                      16       23              10
  Not sure                                      4        3               5

  Note: Percentages may not add up to exactly 100% due to rounding.

                                 TABLE 5
                            COMMUTING METHODS
                   "How do you typically get to work?"
  Base: All adults

                                      Total              Region
                                             East   Midwest   South   West
                                          %     %         %       %      %
  PEOPLE WHO TRAVEL TO WORK (NET)        70    76        70      67     69
     Drive self                          55    58        57      55     48
     Take Public Transportation           4     8         2       3      5
     Walk                                 4     5         4       4      3
     Drive, but as part of a carpool      4     3         3       2      7
     Bike ride                            1     1         *       1      *
     Other                                3     2         4       2      5
  Do not work                            28    22        29      32     29

  Note: Percentages may not add up to exactly 100% due to rounding.

  *Less Than 0.5%

  Methodology
This Harris Poll(R) was conducted online within the United States between January 11 and 18, 2007, among 2,337 adults (aged 18 and over). Figures for age, sex, race, education, region and household income were weighted where necessary to bring them into line with their actual proportions in the population. Propensity score weighting was also used to adjust for respondents' propensity to be online.
All surveys are subject to several sources of error. These include: sampling error (because only a sample of a population is interviewed); measurement error due to question wording and/or question order, deliberately or unintentionally inaccurate responses, nonresponse (including refusals), interviewer effects (when live interviewers are used) and weighting.
With one exception (sampling error) the magnitude of the errors that result cannot be estimated. There is, therefore, no way to calculate a finite "margin of error" for any survey and the use of these words should be avoided.
With pure probability samples, with 100 percent response rates, it is possible to calculate the probability that the sampling error (but not other sources of error) is not greater than some number. With a pure probability sample of 2,337 adults one could say with a ninety-five percent probability that the overall results would have a sampling error of +/- two percentage points. However that does not take other sources of error into account. This online survey is not based on a probability sample and therefore no theoretical sampling error can be calculated.
These statements conform to the principles of disclosure of the National Council on Public Polls.
  J29494
  Q905, 910, 915, 920, 925

  The Harris Poll (R)#16, February 22, 2007
  By Regina Corso, Director, The Harris Poll