

"In The Loop"-NASCAR Loop Data Pre-Race Statistical Analysis-Phoenix
 |
DAYTONA BEACH, Fla. (April 18, 2006) – Last season’s races at Phoenix International Raceway produced a sweep by the Busch brothers, with Kurt winning in the spring and his younger brother Kyle winning in the fall.
NASCAR’s Loop Data statistics from those 2005 events provide in-depth breakdowns that illustrate their success at PIR, as they were ranked in the top five of several loop categories.
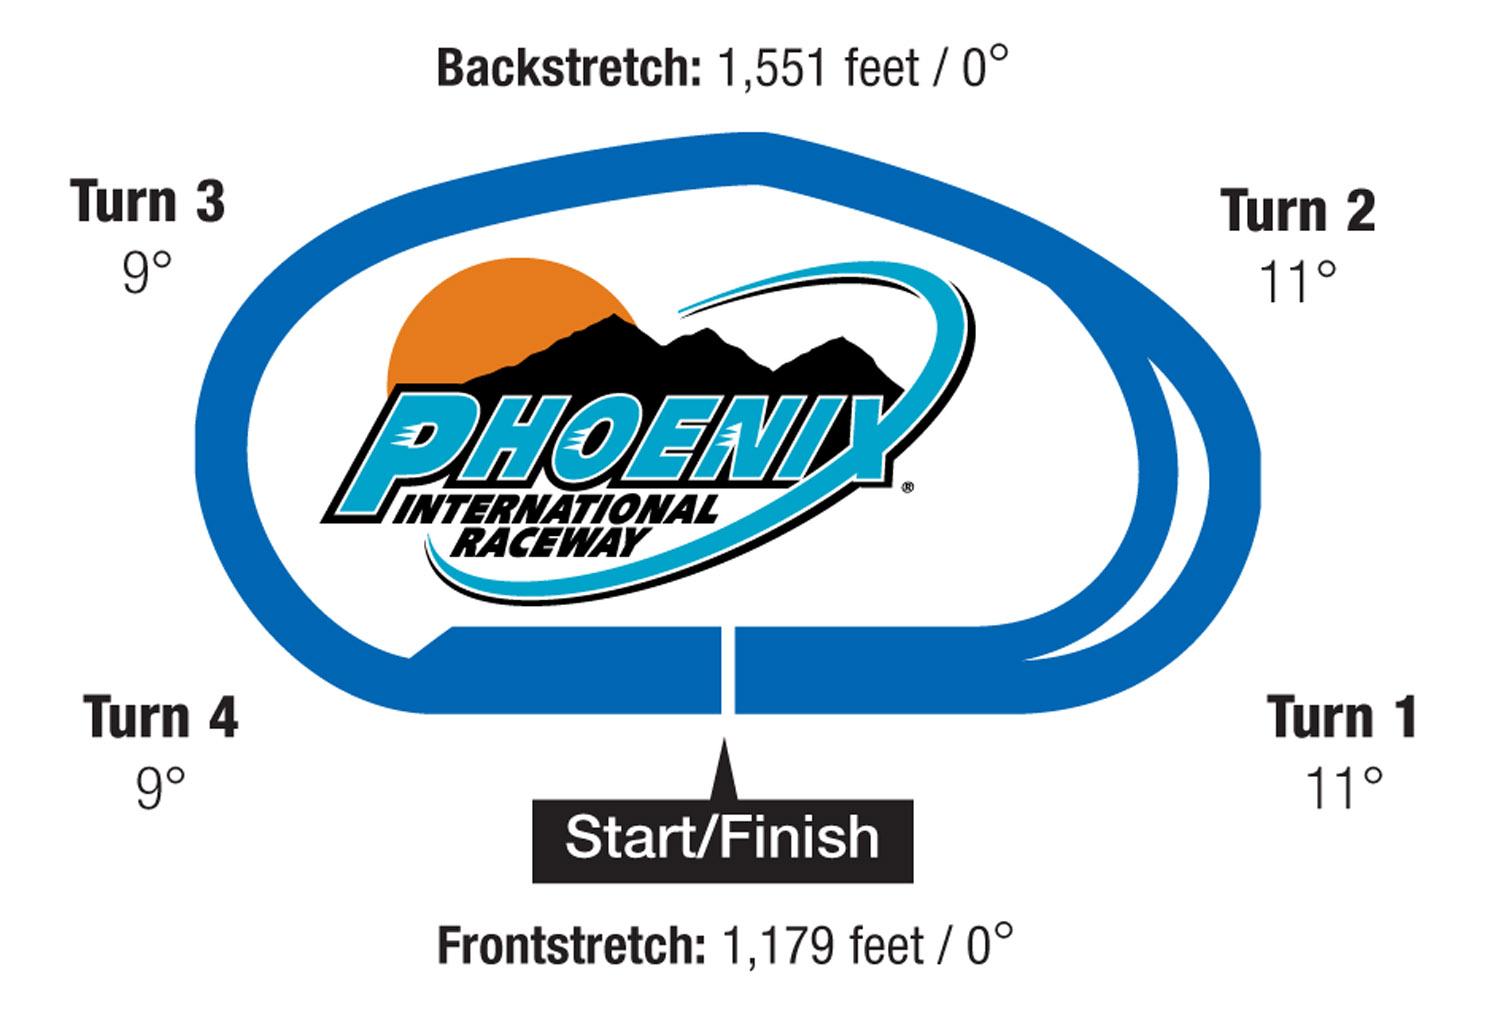
Kurt Busch turned in a dominating performance during last season’s spring event at PIR. Starting the event from the outside pole, he amassed a perfect Driver Rating of 150.0 and led a race-high 219 laps en route to victory.
That was without doubt one of the season’s most-balanced single-race efforts. During that win, in addition to the top Driver Rating, Busch:
•�Had the best Average Running
Position, 1.853.
•�Was the Fastest Driver Late in
a Run, 123.270 mph.
•�Was Fastest on the
Frontstretch, 116.107.
�Also, Busch had the second-best loop numbers in four other categories:
•�Fastest on the
Backstretch, 147.478.
•�Fastest in Turn
1, 118.756.
•�Fastest in Turn 3,
120.823.
•�Fastest Early in a Run,
126.508.
Greg Biffle had a strong car last season at Phoenix as well. Biffle led the field in six Loop Data statistical categories including Fastest Drivers in Turns 1, 2 and 3, as well as being the Fastest Driver Early in a Run. Biffle also ranks second behind Kurt Busch in the Driver Rating category with a rating of 120.7.
If last season’s Loop Data is any indication, look for Bobby Labonte to have a solid run this weekend at Phoenix. Labonte ranked in the top 10 in nine different key Loop Data statistical categories including first-place honors in Speed in Traffic with an average speed of 124.121 mph. Labonte, who recorded two top-10 finishes at Phoenix last season, ranked fifth in Driver Rating with a rating of 103.1. A look at the Passing Report for Labonte shows he made 58 green flag passes at Phoenix last season, including 56 Quality Passes which was good enough to rank him third in the Quality Passes category.
Some surprises from Phoenix include Scott Riggs who ranked third in the Fastest Drivers Late in a Run category and was also the fourth ranked Closer. Travis Kvapil also posted good numbers in the Closers category as well as the Fastest on Restarts category ranking seventh in both statistics, respectively.
|
Average Running
Position |
|
Quality
Passes |
|
Speed In
Traffic | |||
|
Driver |
Average Position |
|
Driver |
Quality Passes |
|
Driver |
Speed (mph) |
|
Kurt Busch |
1.853 |
|
Ryan Newman |
76 |
|
Bobby Labonte |
124.121 |
|
Jeff Gordon |
8.183 |
|
Kyle Busch |
68 |
|
Kyle Busch |
124.079 |
|
Kevin Harvick |
8.340 |
|
Bobby Labonte |
56 |
|
Greg Biffle |
123.992 |
|
Brian Vickers |
8.426 |
|
Carl Edwards |
55 |
|
Carl Edwards |
123.924 |
|
Jimmie Johnson |
8.454 |
|
Jeff Burton |
48 |
|
Jimmie Johnson |
123.835 |
|
|
|
|
|
|
|
|
|
|
Fastest Drivers Early in a
Run |
|
Fastest Drivers Late in a
Run |
|
Fastest on
Restarts | |||
|
Driver |
Speed (mph) |
|
Driver |
Speed (mph) |
|
Driver |
Speed (mph) |
|
Greg Biffle |
126.628 |
|
Kurt Busch |
123.270 |
|
Greg Biffle |
126.323 |
|
Kurt Busch |
126.508 |
|
Michael Waltrip |
122.990 |
|
Matt Kenseth |
124.924 |
|
Kevin Harvick |
125.736 |
|
Scott Riggs |
122.841 |
|
Denny Hamlin |
124.884 |
|
Matt Kenseth |
125.533 |
|
Johnny Sauter |
122.817 |
|
Kevin Harvick |
124.575 |
|
Carl Edwards |
125.388 |
|
Jeff Gordon |
122.506 |
|
Kurt Busch |
124.381 |
NASCAR Busch Series
Carl Edwards qualified on the pole and never fell lower than the fourth position en route to an impressive win in the fall event at Phoenix where he led 103 of 200 laps. Edwards’ strong performance helped propel him to the top spot in the Driver Rating category with a rating of 123.8. Edwards sits second in the Closers category improving a total of five positions trailing Paul Menard who leads this category improving seven positions.
Greg Biffle battled from the 20th starting position completing 45 green flag passes to win the spring event at Phoenix. Biffle’s ascent through the field helped him record the third best Driver Rating with a rating of 122.3. Biffle paced the field in Turns 1 and 3 leading the Fastest Drivers in Turns 1 and 3 statistics.
Joe Nemechek completed 43 green flag passes and leads the way on the Quality Passes chart recording 25 quality passes last season at Phoenix. NASCAR Busch Series points leader Kevin Harvick had the fastest Speed in Traffic last season at Phoenix, averaging 125.304 mph.
Closers Fastest Drivers
Frontstretch Fastest Drivers
Backstretch Driver Positions Gained Driver Speed (mph) Driver Speed (mph) Paul Menard 7 Tony Stewart 116.694 David Stremme 146.379 Carl Edwards 5 Kevin Harvick 116.082 Kevin Harvick 146.288 Kevin Lepage 4 David Stremme 115.985 Denny Hamlin 146.174 Brent Sherman 4 Elliott Sadler 115.668 Tony Stewart 146.062 Martin Truex Jr. 3 Michael Waltrip 115.643 Carl Edwards 146.025
The complete set of pre-race loop data statistics for Phoenix International Raceway can be accessed at www.nascarmedia.com.
NASCAR Loop Data Statistics � Glossary & DefinitionsAverage Running Position � Sum of driver position on each lap, divided by the laps run in the race.
Box Score � A summary which shows key statistics to give a complete picture of the drivers� performance throughout the race.
Closers � The number of positions that a driver improves over the last 10 percent of the race.
Consecutive Laps With A Pass � Number of consecutive laps with at least one pass.
Consecutive Passes Without Being Passed � Number of consecutive passes without being passed.
Fastest Drivers By Straightaway � Ranks each driver by average speed on each straightaway.
Fastest Drivers By Turn � Ranks each driver by average speed in each turn.
Fastest Drivers Early In Run � Ranks each driver during the first 25 percent of laps run in a typical full green flag segment.
Fastest Drivers Late In Run � Ranks each driver during the final 25 percent of laps run in a typical full green flag segment.
Fastest On Restarts � Shows average speed on the first two laps under green flag conditions.
Laps Driver Improved Position � The total number of laps during a race where a driver improved his position.
Passing Breakdowns � For each driver, shows how many and what percentage of passes were made by each turn and each straightaway, including the total number of passes for each driver.
Quality Passes � Number of times a driver passes another car that is running in the top 15 under green flag conditions.
Speed In Traffic � The speed when there is another vehicle within one car length under green flag conditions.
Time Trailing At Finish � The time behind the leader that each driver finished behind the race winner. Average green flag lap time is used to calculate cumulative time for drivers not on the lead lap.
Top 5 Drivers Performance Graph � Graphic showing the progressive performance of the top-five finishers at different intervals throughout the race.
Fast Facts
What: NASCAR Statistical Loop Data; gathered from scoring loops placed at on-track intervals
Driver Rating (based on 2005 at Phoenix International Raceway)
NASCAR NEXTEL Cup Series
1. Kurt Busch* 150.0
2. Greg Biffle 120.7
3. Kyle Busch 106.6
4. Carl Edwards 104.6
5. Bobby Labonte 103.1
6. Jeff Gordon 102.9
7. Denny Hamlin* 100.7
8. Jimmie Johnson 99.8
9. Brian Vickers 98.0
10. Tony Stewart 96.4
NASCAR Busch Series
1. Carl Edwards 123.8
2. Tony Stewart* 123.4
3. Greg Biffle 122.3
4. Elliott Sadler* 119.2
5. Matt Kenseth* 118.2
6. Kevin Harvick 117.0
7. Martin Truex Jr. 103.9
8. Denny Hamlin* 103.2
9. Jason Leffler 103.1
10. J.J. Yeley 101.1
* Ranking only considers one race at Phoenix