

American Honda Reports June Auto Sales: 48-Percent Surge Nets Best June Sales Since 2008; Honda CR-V and Acura RDX Set Best-Ever June Records
 |
Honda division sales up 45 percent, Acura sales up 76 percent
TORRANCE, CA--July 3, 2012: American Honda today reported June 2012 U.S. sales of 124,808 units, an increase of 48.8 percent compared with June 2011 (an increase of 43.3 percent based on the daily selling rate*). The Honda Division posted June 2012 sales of 109,438 units, an increase of 45.6 percent compared with June 2011. Acura's U.S. June sales of 15,370 units increased 76.5 percent compared with June 2011.
Honda
- CR-V sets sixth-consecutive monthly sales record with a new June
record (23,282 units), up more than 50 percent from June 2011
- Accord sales top 28,000 units, up more than 80 percent from June 2011
- Exceptional month for core Honda products (Accord, Civic, CR-V) with sales up more than 50 percent from last June for each model
"With robust inventories and great customer demand, it feels good to be back in the race," said John Mendel, American Honda executive vice president of sales. "The strong performance of our core models, including another record-breaking month for the CR-V, demonstrates the fundamental competitiveness of Honda products."
Acura
- Total Acura sales of 15,370 units were up 76.5 percent over June 2011, the best June sales since 2007
- The new RDX continued its sales success with another record sales month (3,090 units), up 189.3 percent. In May, the RDX was the best-selling compact luxury SUV and is expected to retain that position for June
- Acura light trucks posted a best-ever June result of 8,278 units, up 82.1 percent from last year
- Both the TL and TSX enjoyed substantial sales increases over June 2011, up 47.1 percent and 43.9 percent respectively. With national advertising just starting in June, the all-new ILX has begun to build both inventory and awareness, posting June sales of 1,081 units
"The weather may be too hot in many parts of the country, but Acura sales are continuing to heat up," said Jeff Conrad, vice president of Acura sales. "With our light trucks setting records and our volume sedans showing major increases, it's going to be a great summer for Acura."
*The daily selling rate (DSR) is calculated with 27 days for June 2012 and 26 days for June 2011. Year-to-date, the DSR is calculated with 154 days for 2012 and 152 days for 2011. All other percentages in release are unadjusted; see table for adjusted DSR figures.
|
American Honda Vehicle Sales For June 2012 |
||||||||
|
|
Month-to-Date |
|
Year-to-Date |
|
||||
|
|
June |
June |
DSR** |
MoM |
June |
June |
DSR** |
YoY |
|
|
2012 |
2011 |
% Chg. |
% Chg. |
2012 |
2011 |
% Chg. |
% Chg. |
|
American Honda Total |
124,808 |
83,892 |
43.3% |
48.8% |
700,982 |
607,442 |
13.9% |
15.40% |
|
Total Car Sales |
69,003 |
44,261 |
50.1% |
55.9% |
385,627 |
338,715 |
12.4% |
13.85% |
|
Total Truck Sales |
55,805 |
39,631 |
35.6% |
40.8% |
315,355 |
268,727 |
15.8% |
17.35% |
|
Honda Total Car Sales |
61,911 |
40,098 |
48.7% |
54.4% |
348,497 |
308,267 |
11.6% |
13.05% |
|
Honda Total Truck Sales |
47,527 |
35,086 |
30.4% |
35.5% |
279,549 |
238,495 |
15.7% |
17.21% |
|
Acura Total Car Sales |
7,092 |
4,163 |
64.0% |
70.4% |
37,130 |
30,448 |
20.4% |
21.95% |
|
Acura Total Truck Sales |
8,278 |
4,545 |
75.4% |
82.1% |
35,806 |
30,232 |
16.9% |
18.44% |
|
Domestic Car Sales |
60,304 |
34,296 |
69.3% |
75.8% |
332,168 |
264,427 |
24.0% |
25.62% |
|
Honda Division |
55,846 |
32,000 |
68.1% |
74.5% |
312,866 |
249,013 |
24.0% |
25.64% |
|
Acura Division |
4,458 |
2,296 |
87.0% |
94.2% |
19,302 |
15,414 |
23.6% |
25.22% |
|
Domestic Truck Sales |
52,777 |
37,928 |
34.0% |
39.2% |
279,144 |
248,675 |
10.8% |
12.25% |
|
Honda Division |
44,499 |
33,383 |
28.4% |
33.3% |
243,338 |
218,443 |
9.9% |
11.40% |
|
Acura Division |
8,278 |
4,545 |
75.4% |
82.1% |
35,806 |
30,232 |
16.9% |
18.44% |
|
Import Car Sales |
8,699 |
9,965 |
-15.9% |
-12.7% |
53,459 |
74,288 |
-29.0% |
-28.04% |
|
Honda Division |
6,065 |
8,098 |
-27.9% |
-25.1% |
35,631 |
59,254 |
-40.6% |
-39.87% |
|
Acura Division |
2,634 |
1,867 |
35.9% |
41.1% |
17,828 |
15,034 |
17.0% |
18.58% |
|
Import Truck Sales |
3,028 |
1,703 |
71.2% |
77.8% |
36,211 |
20,052 |
78.2% |
80.59% |
|
Honda Division |
3,028 |
1,703 |
71.2% |
77.8% |
36,211 |
20,052 |
78.2% |
80.59% |
|
MODEL BREAKOUTS BY DIVISION |
|
|
|
|
|
|
|
|
|
Honda Division Total |
109,438 |
75,184 |
40.2% |
45.6% |
628,046 |
546,762 |
13.4% |
14.87% |
|
Fit |
4,584 |
4,912 |
-10.1% |
-6.7% |
24,290 |
34,418 |
-30.3% |
-29.43% |
|
Accord |
28,924 |
15,712 |
77.3% |
84.1% |
155,178 |
127,105 |
20.5% |
22.09% |
|
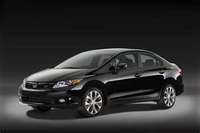
Civic * |
27,500 |
17,485 |
51.5% |
57.3% |
162,582 |
127,571 |
25.8% |
27.44% |
|
Memo: Civic Hybrid |
548 |
418 |
26.2% |
31.1% |
4,118 |
2,433 |
67.1% |
69.26% |
|
S2000 |
0 |
2 |
-100.0% |
-100.0% |
0 |
3 |
-100.0% |
-100.00% |
|
Insight |
494 |
1,021 |
-53.4% |
-51.6% |
4,041 |
11,158 |
-64.3% |
-63.78% |
|
CR-Z |
409 |
966 |
-59.2% |
-57.7% |
2,404 |
8,012 |
-70.4% |
-70.00% |
|
FCX Clarity |
0 |
0 |
0.0% |
0.0% |
2 |
0 |
0.0% |
0.00% |
|
Odyssey |
11,275 |
7,234 |
50.1% |
55.9% |
61,756 |
52,968 |
15.1% |
16.59% |
|
Crosstour |
1,826 |
1,395 |
26.0% |
30.9% |
8,963 |
10,041 |
-11.9% |
-10.74% |
|
Pilot |
9,959 |
9,035 |
6.1% |
10.2% |
54,876 |
51,618 |
4.9% |
6.31% |
|
CR-V * |
23,282 |
15,493 |
44.7% |
50.3% |
146,682 |
110,916 |
30.5% |
32.25% |
|
Element |
0 |
1,342 |
-100.0% |
-100.0% |
3 |
7,767 |
-100.0% |
-99.96% |
|
Ridgeline |
1,185 |
587 |
94.4% |
101.9% |
7,269 |
5,185 |
38.4% |
40.19% |
|
Acura Division Total |
15,370 |
8,708 |
70.0% |
76.5% |
72,936 |
60,680 |
18.6% |
20.20% |
|
TL |
3,377 |
2,296 |
41.6% |
47.1% |
18,053 |
15,414 |
15.6% |
17.12% |
|
TSX |
2,602 |
1,808 |
38.6% |
43.9% |
17,614 |
14,209 |
22.4% |
23.96% |
|
Memo: TSX Wagon |
397 |
122 |
213.4% |
225.4% |
2,050 |
1,657 |
22.1% |
23.72% |
|
ILX |
1,081 |
0 |
0.0% |
0.0% |
1,249 |
0 |
0.0% |
0.00% |
|
Memo: ILX Hybrid |
115 |
0 |
0.0% |
0.0% |
149 |
0 |
0.0% |
0.00% |
|
RL |
32 |
59 |
-47.8% |
-45.8% |
214 |
825 |
-74.4% |
-74.06% |
|
MDX |
5,125 |
3,374 |
46.3% |
51.9% |
24,117 |
22,195 |
7.2% |
8.66% |
|
ZDX |
63 |
103 |
-41.1% |
-38.8% |
416 |
950 |
-56.8% |
-56.21% |
|
RDX |
3,090 |
1,068 |
178.6% |
189.3% |
11,273 |
7,087 |
57.0% |
59.07% |
|
Selling Days |
27 |
26 |
|
|
154 |
152 |
|
|
|
* Honda and Acura vehicles are made of domestic & global sourced parts. |
|
|
||||||
|
** Daily Selling Rate |
|
|
|
|
|
|
||
|
|
|
|
|
|
|
|
|
|
|
|
Month-to-Date |
|
Year-to-Date |
|
||||
|
|
June |
June |
DSR** |
MoM |
June |
June |
DSR** |
YoY |
|
|
2012 |
2011 |
% Chg. |
% Chg. |
2012 |
2011 |
% Chg. |
% Chg. |
|
|
|
|
|
|
|
|
|
|
|
Hybrid |
1,566 |
2,405 |
-37.3% |
-34.9% |
10,712 |
21,603 |
-51.1% |
-50.41% |
|
|
|
|
|
|
|
|
|
|