International Brands US Auto Sales Scoreboard January 2018
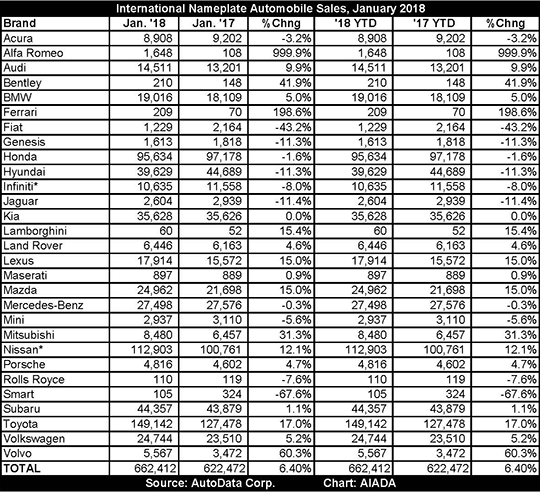
International brands led the American auto industry in January. Some of the brands driving the charge included BMW (up 5 percent from last January), Nissan (up 12.1 percent), and Toyota (up 17 percent). Toyota had its best month ever for light truck sales and saw the redesigned Camry’s sales climb 21.3 percent to be the most popular sedan in America. Throughout the industry, light trucks continued to drive sales demand last month, rising 8 percent as a segment, while cars lagged, slipping 10.8 percent.
“Last month, international brands outperformed the auto market as a whole,” said AIADA President Cody Lusk. “Dealers of these brands are starting the year off on a high note and anticipating strong consumer interest in the first quarter, driven in part by tax reform.”
2018 Market Share Off to a Strong Start
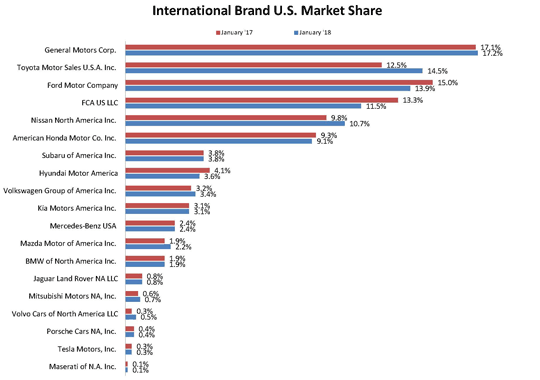
International brands kicked off 2018 with a 57.4 percent share of the U.S. auto market, up 6.4 percent from the 54.4 percent share they held last January and the 55.1 percent share they occupied in December. Overall, they sold 662,412 vehicles, up from 622,472 vehicles in January 2017, but down from 882,393 units in December.
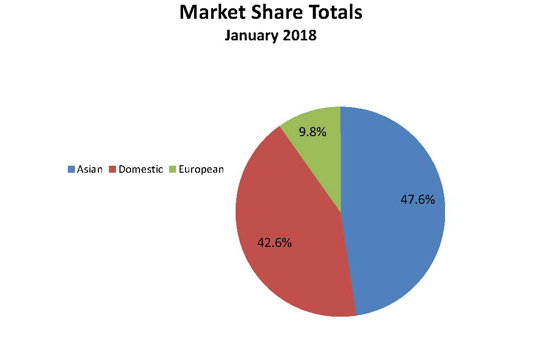
Asian brands captured the largest share of the U.S. auto market in January, landing ahead of domestic brands with a 47.6 percent share and sales of 549,805 vehicles. The figures were up 6.6 percent from last January when they held 45.1 percent of the U.S. auto market and sold 515,916 units. However, in keeping with general trends in January, sales for the first month of the year were down from December when Asian brands captured 44.7 percent of the American market and sold 715,897 vehicles.
European brands maintained a strong sales pace as they started 2018, with sales up 5.7 percent over January 2017. Led by Volkswagen, these brands occupied 9.8 percent of the U.S. auto market and sold 112,607 vehicles. In January 2017, they occupied 9.3 percent and sold 106,556 vehicles. Despite the strong start to the year, European brand sales also reflected the industry-wide trend toward slower vehicles following the December sales month when they sold 166,496 vehicles and occupied 10.4 percent of the market.
Finally, domestic brands finished January with a 42.6 percent share of the market and sales of 492,473 vehicles. Sales were down 5.5 percent from last January when they occupied 45.6 percent of the market and sold 520,949 vehicles. They were also a decrease from December’s sales figures of 720,736 vehicles and their 45 percent share of the market.
Trucks and SUVs Dominate
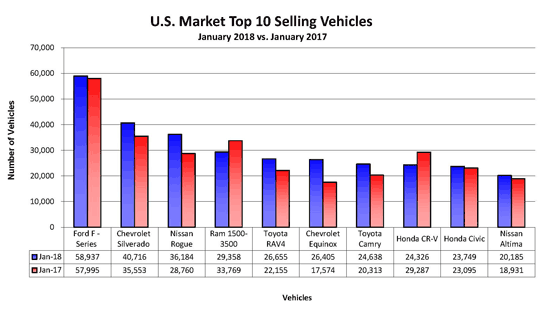
Trucks and SUVs continued to dominate the sales charts in January, setting the stage for another strong performance in 2018. Only three cars – the Toyota Camry, Honda Civic, and Nissan Altima – landed on the month’s list of top-ten sellers.
The Ford F-Series and Chevrolet Silverado remained in the top two positions, with sales for the Ford F-Series up 1.6 percent and the Chevrolet Silverado up 14.5 percent from January 2017. The Ram 1500-3500 pickup joined them in fourth place for the month with sales down 13.1 percent.
In third place, the Nissan Rogue was the most popular SUV/crossover for the month, with sales up 25.8 percent from last January. It was joined on the leaderboard by the Toyota RAV4 in fifth place (sales up 20.3 percent), the Chevrolet Equinox in sixth place (sales up 50.3 percent), and the Honda CR-V in eighth place (sales down 16.9 percent).
North American Manufacturing Supplies Vehicles for U.S.
With Washington, D.C.’s focus on NAFTA, it’s important to note that North American manufacturing units operated by international automakers churned out 415,026 vehicles on their American dealer lots in January. These included 181,577 Asian cars; 205,520 Asian trucks; 10,934 European cars; and 16,995 European trucks.
Outlook
AutoData Corp. reports that the seasonally adjusted annual rate (SAAR) for December was 17.12 million units versus 17.44 million units a year ago. Total industry unit deliveries, including all brands and unadjusted for business days, increased 1 percent compared to last January. Sales were down 28 percent compared to December 2017, in part, theorized analysts, due to the blistering cold that blanketed much of the country in January.


